Blog
he Planning Research Institute is a leading, UK-based centre in all aspects of urban and environmental planning
How many new homes should your local authority plan for? Where should the number of houses, determined nationally, be distributed? Questions like this are hugely significant issues for the general public as well as local and national government. In England alternative methods to answer these questions have been attracting significant attention.
The White Paper, Planning for the Future, includes a proposal for a new Standard Method to assess the number of new dwellings that local authorities need to plan for.
Researchers at the Planning Research Institute have undertaken analysis of the different housing need numbers between the original Standard Method and the proposed alternative.
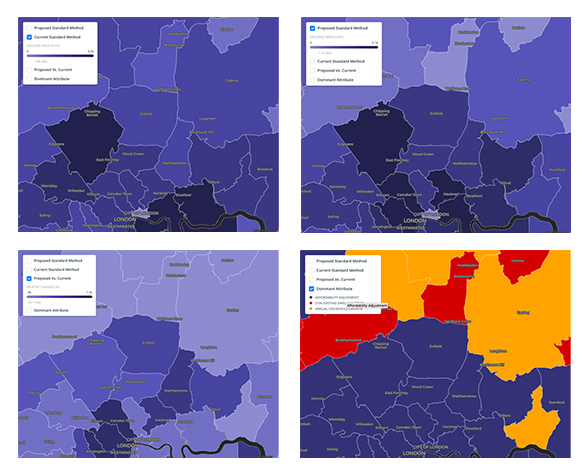
The interactive map at the foot of this blog shows each local authority area in England, with layers for the housing need numbers under both the original and proposed Standard Methods as well as a layer showing the dominant attribute in driving the change in housing need under the proposed Standard Method versus the original.
The text below explains the original Standard Method, the method proposed in the White Paper, the change in housing need numbers between the two and the dominant attribute driving this change.
Methods
The Original Standard Method
The original Standard Method, introduced by the Ministry of Housing, Communities and Local Government (MHCLG) in February 2019, has three aspects. Firstly, it comprises a set of variables that seek to understand the demography of housing need. This includes population data published by the Office for National Statistics (ONS) which is used to estimate household formation alongside variables such as local authority death and fertility rates. Secondly, an affordability ratio is included that relates median work-place based incomes to median house prices in local authorities. Finally, a constraint is included to limit the scale of required new development for any single local authority.
The application of the Standard Method results in a national total of 250,553 new dwellings per annum. However, the geography of how this housing need is distributed throughout England is highly variable – and some local authorities have elected to pursue higher targets as a result of longer standing commitments through prior Strategic Housing Market Assessments.
To explore the distribution of housing need resulting from the original Standard Method simply select ‘current Standard Method’ on the interactive map at the foot of this article.
The Proposed Standard Method
The White Paper, Planning for the Future, published in August 2020 proposes a new Standard Method for the assessment of housing need. Although the proposed Standard Method shares some similarities with the original it also has two significant differences. Firstly, it introduces a floor target of 0.5% of the existing housing stock present in a local authority area. So, rather than only using household projections as the baseline, as is the case in the original Standard Method, the revised methodology dictates that the minimum housing need will be set as whichever is higher of the most recent annual household projection growth or 0.5% of the existing housing stock. Secondly, the baseline level of housing need is then adjusted by the change in affordability over the preceding 10 years. Unlike the original Standard Method, the proposal does not include a cap applied to limit the level of increase for individual authorities.
The proposed Standard Method results in a national target of 337,254 new dwellings per annum. To explore the distribution of housing need resulting from the original proposed Standard Method simply select ‘proposed Standard Method’ on the interactive map.
Understanding the effect of the change in Standard Method
The change from the original to the proposed Standard Method results in hugely significant variations ranging from -968 to +4255 units per annum across the 317 English local authorities. This represents a relative change of between -38% and +1300%.
So which local authorities would see the majority of new housing development? The most sizeable increases are found in London, the South East and South West. These three regions combined account for an absolute change of 58,365 dwellings per annum, which represents two thirds of the overall growth in the housing requirement under the proposed Standard Method. London boroughs alone account for 37,511 additional dwellings under the proposed Standard Method. The local authority with the most significant change under the proposed Standard method versus the original is Westminster which sees its housing need increase from 1,495 dwellings per annum to 4,255.
By contrast some local authorities see a significant reduction in the number of new dwellings required under the proposed Standard Method. For example, York, Newcastle-upon-Tyne, Manchester, Liverpool, South Cambridgeshire and North Hertfordshire all see their housing need figures decline by over 25% under the proposed Standard Method. The variation in housing need for each of the 317 local authorities in England is shown by selecting “proposed vs. current” on the interactive map.
What drives the change in housing need?
A statistical analysis shows that there are three main attributes driving variation in the levels of housing need that result under the proposed Standard Method: the change to the computation of the affordability measure, the imposition of a floor of 0.5% of the existing housing stock and a change in the way the demographic drivers of household growth are measured.
By selecting “dominant attribute” on the interactive map the most significant driver of change in housing need in each local authority in England is shown.
Where next for the Standard Method?
The scale of new development suggested by the White Paper’s proposed changes to the Standard Method for the computation of housing need has received significant press coverage. Some speculation has even suggested that MHCLG may already be re-thinking the calculation only months after it was first proposed.
Meeting housing need in a way that is sustainable, publicly accepted and aligned with market pressure is likely to continue to be an important policy question that may require a more nuanced approach. Understanding the how to balance the calculation of housing need within the highly variable context offered by English local authorities will continue to be a core interest for researchers at the Planning Research Institute.
How to use the maps?
Toggle on and off the four layers to the interactive map in the top left-hand corner, by selecting one layer at a time as illustrated in the example below.
For more information please contact:
Prof. Alex Lord: a.d.lord@liverpool.ac.uk