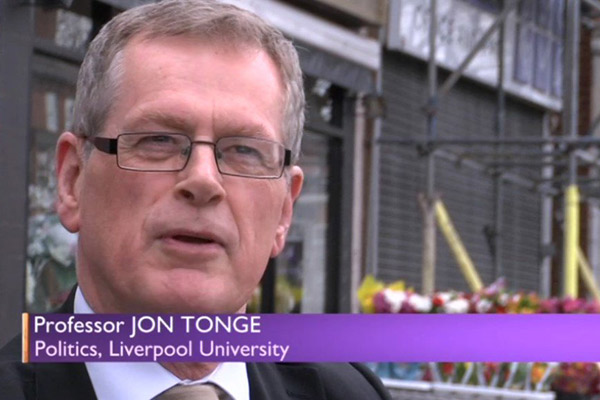
With local elections for the North West coming up in May, politics expert Jon Tonge gives us his guide to the state of play for this year’s council elections, in comparison to 2014:
"The direct comparison for most local authorities in terms of election cycle for these elections is with 2014, based on the four-year cycle – 3 years of elections plus one fallow year i.e. it was in 2014 that most of the councillors defending their seats were elected.
The 2014 local elections were held on the same day as what turned out to be our last-ever European Parliament (EP) elections – and UKIP’s strong performance in the EP elections spilled over slightly into the local contests. So, there are a lot of UKIP votes to play for.
Labour performed only moderately well nationally in 2014, gaining 324 council seats (below what might have been expected – an indication of their looming 2015 election defeat) – but Labour did do well (as usual) in the North West."

Top ten points to consider...
- North West vote shares in 2014 were as follows: Lab 45%, Con 22%, UKIP 16%, LD 12%, Others 5% - so clearly there is a sizeable UKIP vote to compete for.
- Labour won 71% of the NW seats contested in 2014, Cons 17% and LDs 10%. On the councils being contested on 3 May, Lab holds 69% of the seats, Cons 19%, LDs 9%.
- The rout of the Lib Dems continued apace in 2014. After those election results, they had lost 228 councillors across these 26 councils from the 379 they held (60% loss) when joining the coalition government in 2010. The Conservatives lost 141 councillors from the 432 they held between 2010-14 (33%).
- The UKIP vote share was variable in 2014: low in big cities (5% Liverpool, 8% Manchester) and in Con-Lab Trafford contest (6%); high in Bolton (25%) & Oldham (24%)
- Although 2014 is the ‘official’ comparison, many will prefer to compare these results to 2016, the last time these councils held elections.
- Of the 25 councils being contested, 21 are held outright by Labour. Two are NOC but under Labour minority control, the Conservatives hold Trafford only and the Liberal Democrats run South Lakeland.
- Background of continuing cuts and largest increase in council tax (up to 5.99%) for a decade– due to an increase to 5% (effectively 6% with the social care precept) (from a previous limit of 2% increases before a referendum is needed) - but this 6% increase is for 3 years - councils are frontloading the cash.
- All 96 seats in Manchester are contested due to boundary changes.
- Labour’s dominance is summarised as follows. The Party controls 84% of the councils and holds 71% of the council seats – on 45% of the vote.
- Formerly marginal or swing councils such as Bury, Chorley, Hyndburn and Oldham have become increasingly solid Labour.
Find out more
- Download Jon's full North West Council Elections 2018 report
- Find out more about politics at Liverpool