University of Liverpool financial information 2023/24
The University of Liverpool is a major higher education institution and a member of the Russell Group.
We run more than 400 undergraduate and postgraduate courses, have an alumni network spanning almost 280,000 people across 170 countries, boast collaboration with 1,300 external organisations and have 91% of our research rated world leading and internationally excellent. Each year we open our doors to learners, staff and partners from all walks of life and all corners of the globe.
In this section:
- Financial surpluses
- Preparing for the future
- Income
- Expenditure
- How the £9,250 tuition fee is spent.
Our total income in 2023/24 was £708.3 million. Our total expenditure of £521.1 million was £187.2 million lower than our total income generating a surplus.
Our expenditure has been significantly reduced by a one-off decrease in the Universities Superannuation Scheme (USS) pension provision following implementation of the 2023 actuarial valuation. This movement in pension provision does not impact our cash position so it is important to look at the surplus excluding these adjustments. Excluding non-cash pension adjustments, our underlying operating surplus for 2023/24 is £0.6m.
| 2023/24 (£m) |
2022/23 (£m) |
|
|---|---|---|
| Surplus | 187.2 | 10.3 |
| Non-cash pension adjustments | (186.6) | 0.5 |
| Underlying Operating Surplus | 0.6 | 10.8 |
Our underlying operating surplus has fallen in comparison to the previous year (2022/23 - £10.8 million) as a result of a several external factors including:
- Erosion of the value of the home tuition fee (set by the UK Government for UK students), which has been capped at the same level (with one small rise in 2017) for 12 years - a real terms cut of around 30%. The recently announced rise in tuition fees to £9,535 which will come into operation from September 2025 will impact the next financial year (2025/26) and will be offset by the 2% rise in employer National Insurance contributions that came into effect from April 2025
- Ongoing sector-wide challenges with recruiting new international students following UK immigration policy changes
- Cost inflation including pay, energy, capital costs and consumables.
These are sector-wide issues and whilst Liverpool is in a stronger position than many, we are not immune to these challenges. Steps are being taken at an early stage to help secure the long-term financial sustainability of the University through strong cost controls, and also diversifying and increasing our income across our education, research and partnerships activity.
The summary below aims to show the sources of our income, as well as how we use that income to support our operations, pay our staff, provide financial support to students, keep the University running well and prepare for the future.
If you would like to know more about us then please visit our financial information webpages.
Financial surpluses
The University of Liverpool is a ‘not for profit’ organisation which means that any annual operating surplus is reinvested in the University and we do not pay dividends to shareholders.
Generating surpluses in most years is an essential part of ensuring the financial health of our institution. Financial sustainability requires a position whereby the institution can cover operating costs but also generate resources for investment. Our longer-term strategy is to achieve an underlying operating surplus of 5% in order to enable continued investment in strategic priorities.
Read more about Liverpool 2031: Our strategic ambition.
At the end of each financial year any recorded surplus is added to our reserves which are used to fund investment that can’t be met from our normal recurrent sources of income.
This includes safeguarding university finances against unforeseen adverse circumstances and funding large investments such as building and facility improvements or enhancing digital technology.
Preparing for the future
Capital investments are an important part of preparing the University for the future. These investments, which are not included in the expenditure for the year quoted above, or the pie charts below, total £69.6 million for 2023/24, and are funded mainly from surpluses made in previous years. This year the University has invested:
- £19.3 million in software and capital equipment
- £28.9 million in infrastructure programmes of work
- £6.4 million on the refurbishment and extension of the School of Architecture
- £2.6 million on Leahurst Campus lifecycle improvements and AVMA accreditation
- £2.4 million on Vets on Campus
- £10 million on additional smaller projects.
Income
Our income comes from a variety of sources, all of which support our work including government grants for teaching and research which subsidise the cost of more expensive programmes, student fees, donations and income generated through commercial activities.
This chart shows the main sources of our income in 2023/24. Student fees, in total, made up 52% of our income.

The pie chart above shows the main sources of University income:
- 52% came from tuition fees
- 18% came from research grants and contracts
- 13% came from other income
- 8% came from government grants for research
- 5% came from government grants for teaching
- 4% came from residences, catering and conferences.
Expenditure
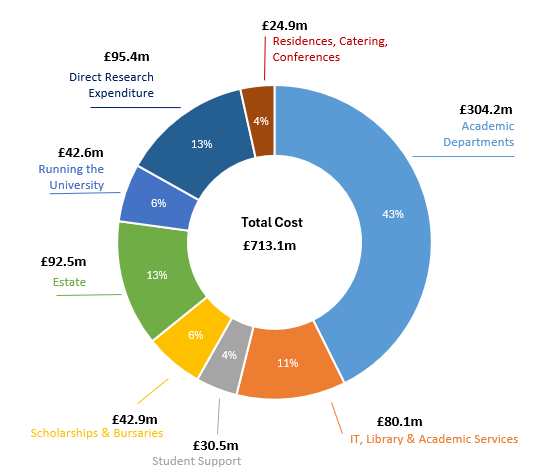
This chart shows how we used our income in 2023/24 to support our activity, from running academic departments to providing support services for students and maintaining our estate, premises and facilities.
The cost of academic departments and academic support services represents 54% of the University’s total expenditure. The remaining expenditure is essential in supporting the quality of the student experience.

The pie chart above shows how we used our income in 2023/24:
- 43% was spent on academic departments
- 13% was direct research expenditure
- 13% was spent on our estate
- 11% was spent on IT, Library and Academic Services
- 6% was spent on scholarships and bursaries
- 6% was spent on running the University
- 4% was spent on student support
- 4% was spent on residences, catering and conferences.
How the £9,250 tuition fee is spent
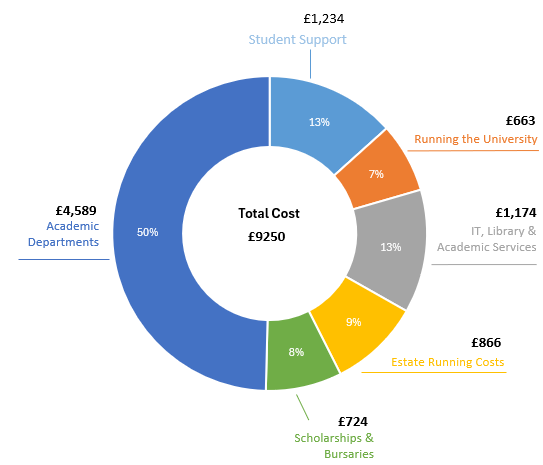
This chart aims to demonstrate how the £9,250 tuition fee was spent in 2023/24.
The areas highlighted in the graph below are also supported by income from other sources, but for the purposes of demonstrating specifically how the £9,250 student tuition fee is spent, we have excluded activity funded by other income including government grants for teaching and research, research grants and contracts, and income from residences, catering and conferences.

The pie chart above shows how how the £9,250 tuition fee was spent:
- 50% on academic departments
- 13% on student support
- 13% on IT, Library and academic services
- 9% on estate running costs
- 8% on scholarships and bursaries
- 7% on running the University.
You can also download the spreadsheet containing this information Financial information for students (Excel document, 57KB).
Tuition fee rise for 2025/26
The Government has announced that tuition fees for UK or ‘Home’ undergraduate students will rise in line with inflation to £9,535 a year with effect from the 2025/26 academic year. Maintenance loans will also increase to help students with the cost of living.
This change will not see most students paying more upfront to study. For most, fees are paid initially by the Student Loans Company and repayments afterwards are linked to your earnings above a £25,000 threshold. The amount you repay each year after graduation depends entirely on what you earn, rather than what you borrow.
Monthly repayments are fixed at 9% of your salary above the threshold and any outstanding balance after 40 years is automatically cleared, which means that only higher earners who will clear their balance within this time will pay more overall.
Find out more about scholarships and bursaries on our webpages. You can get financial support and advice by contacting our dedicated Money Advice and Guidance team.