SAVSNET in real-time
SAVSNET collects data from veterinary practices and diagnostic laboratories often in real time, and we are increasingly able to clean, evaluate and publish in near real-time. This allows us to identify, in a timely manner, trends in the patterns of disease that affect our pets, either due to seasonality, or potentially, due to an outbreak of a new disease. However, and perhaps more importantly, it is now also allowing us to share these insights with you.
We have a growing number of dashboards (visualisations or 'vizzies) for a range of diseases such as ticks, gastrointestinal disease, grass seeds and important infections as shown in the table below. Where these vizzies have been created based on a piece of research, a link to the work is shown in the 'releated publication' column.
You can access all our published visualisations here.
We only publish these dashboards where they are backed up by a strong scientific base which usually means a peer reviewed publication (see publications above).
It is important to read the following information when using these dashboards.
If you are concerned about the health of your own pet, it is always best to seek advice from your veterinarian – SAVSNET cannot offer advice on an individual animal’s health.
Veterinary practice data
The date used from vets is from individual consultations.
The postcode used is that of the owner; this is mapped to a broader region scale (NUTS) to further protect participating owner and veterinary practice identities.
The denominator used is that of total consultation numbers for the given level of granularity.
Laboratory data
SAVSNET collects data from diagnostic laboratories across the UK for animals being tested for a range of pathogens, both the numbers tested and the results.
The postcode we use to plot the spatial distribution of the laboratory data is that of the submitting veterinary practice, and not the owner.
The date we receive can vary between laboratories (variably sample collection date, sample submission date, sample receipt date or result data) – for the laboratory data we treat these synonymously as they are generally with a few days of each other.
For most pathogens, and only where an expert deems it appropriate, we amalgamate those tests that are broadly suggestive of current infection. For example we would typically merge data for those tests based on isolation and those based on PCR. We do not include data from serology.
Some pathogens are host specific such that the species drop down is not needed. However, for others, such as Bordetella, herpes and parvo it is best to choose the species of interest. Finally for parvovirus, it is best to select both FPV (feline parvovirus / panleukopenia) and PARVO as the pathogen and CAT as the species if you are interested in cats. Similarly for dogs, select both CPV (canine parvovirus) and PARVO from the pathogen list and DOG from the species list. This is to account for the different way individual labs refer to their tests. CAV = canine adenovirus. CDV = canine distemper virus. FCV = feline calicivirus. FELV = feline leukemia virus. FHV = feline herpesvirus.
How to use the site
To open the tableau dashboards please click here.
Use the menus to configure each page. Play with the visualization to get the data view you want…. You can’t break it!
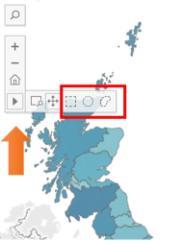
The map functions are really useful but take a bit of getting used to. You can click on the map to select regions of interest either singularly or multiple (use control on your keyboard). There are also various additional selection options available through the triangle menu which appears when you hover over the map. To return to the full country view, click the selected region again.
Disclaimers
Whilst SAVSNET collects data from many of the largest laboratories in the UK and almost 15% of UK veterinary practices, it is not all, and so these results may not be representive of all diagnosed disease in the UK.
Of course we can only report information for those animals that attend a vet, or where the vet submits a sample to a participating laboratory.
Whilst we believe we have a lot of data, we cannot formally say it is representative – it may contain hidden biases.
Changes in the crude numbers of animals with a particular disease or syndrome may represent an actual increase, or possibly where a new lab or veterinary practices have joined SAVSNET, or other external affects such as recent media coverage.
We have made every effort to ensure these infographics give an accurate representation of the data we receive. Their use and interpretation is however not the responsibility of the SAVSNET team. They are best used by veterinarians to inform local decisions about disease control.
SAVSNET dashboards are based on diseases recorded in health records. It is likely that what we identify is an underestimate of the total levels of disease. For example, a vet may not record the presence of a disease either because they did not notice it, or because it was deemed to be of lesser importance than the reason the owner came to the vet. The method we use to identify cases may also miss them because of changes in spelling or local terminology used by the vet. As such, the dashboards are best used to indicate a relative risk, and how this changes over time, geography, and between species and breeds.
If you are concerned about the health of your own pet, it is always best to seek advice from your veterinary practice – SAVSNET cannot offer advice on an individual animal’s health.
Acknowledgements
SAVSNET is extremely grateful to the participating veterinary practices and laboratories, without whose kind participation and collaboration, these data could not be made available. SAVSNET became reality thanks to major funding from BSAVA.
The dashboards we share are individually acknowledged to their main funders, which include BBSRC and Dogs Trust.
We are also indebted to Andrew Brogan, Stefan Melgaard and colleagues in the University of Liverpool's Computing Services Department for helping establish our first Tableau Public presence.
If you use these data, we would ask you use the following acknowledgement:
“These data are generated by SAVSNET. Any interpretation of these data provided alongside is not from SAVSNET”.
Feedback
We welcome your feedback. Please contact us savsnet@liverpool.ac.uk.