Sea level change
|
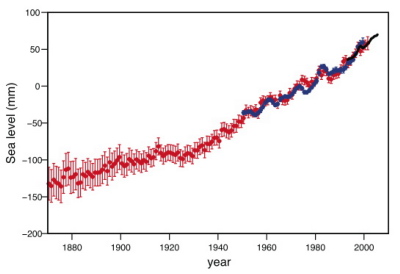
Figure 1. Change in global average sea level (mm) from tide gauge (red) and satellite (based on the difference from 1961-1990 average) with satellite data in black.
|
One of the most important impacts of climate change is sea level (IPCC, 2007):
|
At Liverpool
|
|
Research at Liverpool has highlightedIn the 1990s, sea level rise averaged along the global coastline is slightly higher (~4 mm yr-1) , than in the open ocean (3 mm yr-1) (Holgate and Woodworth, 2004; see blue line in Fig. 1). There has been an increase in extreme high sea level events worldwide since 1975 (Woodworth and Blackmon, 2004). Based on records at Liverpool since 1768, there was a larger maximum surge (measure of extreme sea level) in the late 20th century, late 19th and late 18th centuries, compared with a lower surge over most of the 20th century (Woodworth and Blackman, 2002). The sea level rise is being examined through satellite altimetry providing the open ocean measurements, with ongoing calibration from coastal tide gauges: e.g. Phil Woodworth and Chris Hughes at NOC are Principal Investigators in the Jason-1 project and on the European GRACE Science working team. |
|
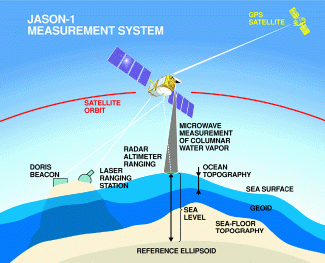
Figure 3. A schematic figure depicting how satellites remotely sense changes in sea level.
|
Presentations
- Miquel Maqueda et al. (POL). Volcanic forcing. Marine Sciences Symposium 2008 'Climate change: the science and the impacts - a Liverpool perspective'
- Phil Woodworth (POL). Sea level change. Marine Sciences Symposium 2008 'Climate change: the science and the impacts - a Liverpool perspective'
- Liverpool Home of UK Sea Level science (POL) (pdf 8Mb)
- Climate Change: Understanding Recent Changes in Sea Level and the Ocean by Philip L. Woodworth (pdf 4Mb)
References
Holgate, S.J. and P.L. Woodworth, 2004: Evidence for enhanced coastal sea level rise during the 1990s. Geophysical Research Letters, 31, L07305, 4 PP.
Church, J.A,, P.L. Woodworth, T. Aarup and W. S. Wilson (editors), 2010. Understanding Sea-level Rise and Variability, Wiley, 456 pp, ISBN: 978-1-4443-3451-7.