Ocean Overturning
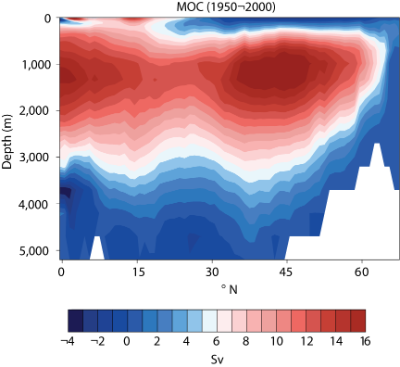
The oceans advect heat over the globe, which reduces the pole-equator temperature contrast. In the North Atlantic, the ocean heat redistribution is mainly achieved by an overturning circulation, involving warm water near the surface move northward and cold water at depth return southward.
There is concern that this ocean overturning might alter with climate change, particularly given melting of sea ice in the Arctic and predictions of high-latitude warming. To address this concern, a joint UK and USA programme, RAPID WATCH, is measuring the overturning at 26.5N. The results have turned out to be surprising, there are larger variations in the overturning on timescales of a few weeks. Making any reliable inference about a climate drift requires a record of several decades.
Example of Work at Liverpool
At Liverpool, we have been diagnosing how overturning is varying over the last 50 years, exploiting historical temperature and salinity data. Between two twenty year periods from 1950 to 1970 and 1980 to 2000, our work suggests that there has been a slight weakening in the overturning in the subtropics and a slight strengthening in the overturning in the subpolar latitudes (Figure 2). These chanegs are probably reversing in time. This work was conducted in collaboration with scientists at Duke University.
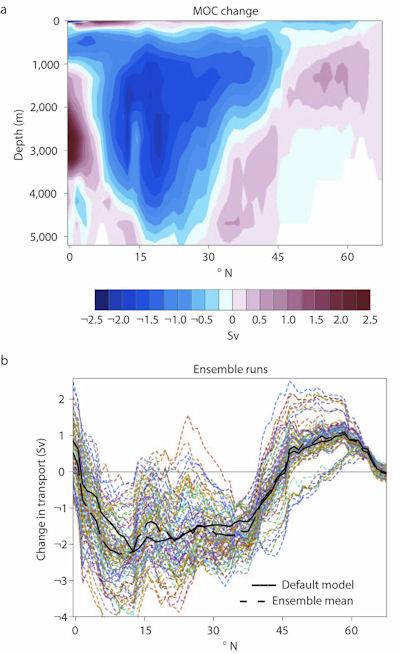
Figure 2. Ocean overturning changes (Sv=106m3/s) between two twenty year periods, 1950 to 1970 and 1980 to 2000: (a) a depth section showing the change in the overturning and (b) an ensemble of model estimates perturbed by changes in the historical data. There is a slight weakening in the overturning in the subtropics and a slight strengthening in the overturning in the subpolar latitudes. Further details in Lozier et al. (2010).
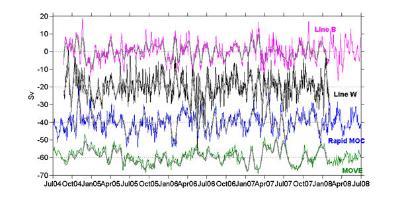
Also at the Natural Environment Research Council (NERC) National Oceanography Centre (NOC) in Liverpool, we are studying how the overturnings measured at different latitudes in the North Atlantic are related to each other (Hughes et al., 2011). By collaborating with several laboratories in Canada and in the USA, as well as with NOC Southampton, we are analysing ocean seafloor pressure measurements which are indicative of the overturning in the North Atlantic (Elipot et al., 2011)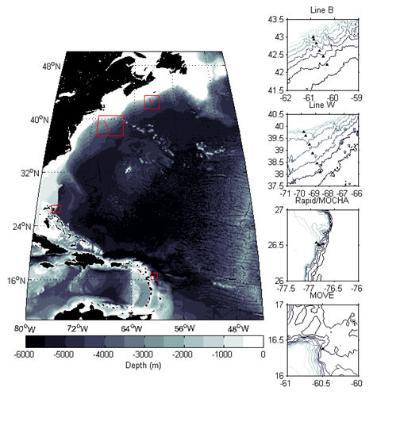
Presentations in the Marine Sciences Symposium 2008
'Climate change: the science and the impacts - a Liverpool perspective' by Chris Hughes (POL) on Ocean conveyer belt: is it changing or not?
References
Lozier, M.S., V. Roussenov, M.S.C. Reed and R.G. Williams, 2010. Opposing decadal changes for the North Atlantic meridional overturning circulation. Nature Geoscience,728-734.
Hughes, C.W., Elipot S., Morales Maqueda, M.A., Bingham R., A window into the deep ocean: Experimental demonstration of a low-drift method for monitoring pressure gradient down the continental slope. In preparation.
Elipot S., Frajka-Williams, E., Hughes C.W., Olhede, S., Lankhorst, M., Willis, J., Coherence of Overturning Transports in the North Atlantic. In preparation.