Open-Source software platforms
Licensed Software
Matlab
Programming language and interactive environment for numeric computation, visualisation etc. Several graphical user interface (GUI) scripts are available for data processing:
- Dynamic contract enhanced (DCE) Magnetic Resonance (MR) images. This GUI pipeline provides reliable fits using multiple pharmacokinetic models for both preclinical and clinical DCE-MRI datasets. It has been recently used to analyse rodent brain tumour as well as mouse kidney perfusion studies in the lab. It is also being evaluated for clinical brain tumour and head and neck cancer DCE-MRI studies performed at Walton Imaging Centre, Liverpool as well as University of Pennsylvania, USA. The following article should be cited if this package is used:
Bhaduri et.al. Cancers 2022, 14, 1223. https://doi.org/10.3390/cancers14051223
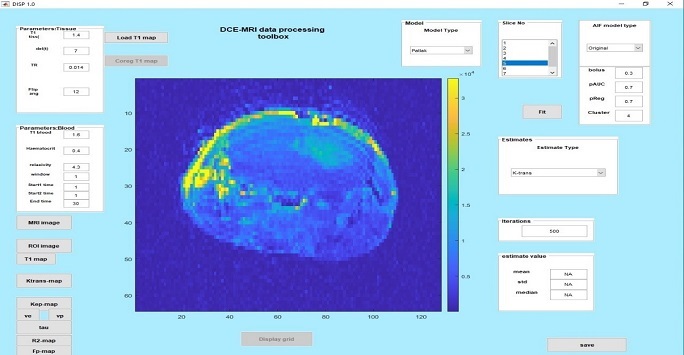
Figure 1: Representative parametric map using the DCE-MRI GUI data from a mouse brain tumor model. The tumour has higher perfusion/permeability (ktrans) compared to the normal brain. The figure shows the functionality and options available in the GUI for parameter estimations using different pharmacokinetic models as well as inputting starting values for various parameters
- Diffusion Weighted Imaging (DWI) Intravoxel Incoherent Motion (IVIM) MR images: The toolbox includes functions to perform IVIM fitting of DWI data. This is currently being used in rodent brain tumour studies and also in kidney and liver diffusion imaging.
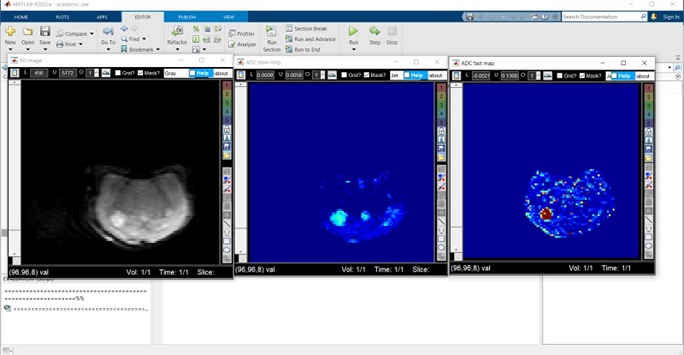
Figure 2: Representative image showing the screen shot of the DWI-IVIM analysis GUI in Matlab. The image in the left shows T2-weghted (B0) image without any diffusion gradients showing the tumour as a bright region, the image in the middle is the apparent diffusion coefficient (ADC slow) map while the image in the right is the ADC fast map demonstrating higher values than the normal brain.
Amira 6.2
Software platform for 3D and 4D data visualization, processing, and analysis. Amira’s set of tools allows the user to mark (or segment) structures and regions of interest in 3D image volumes using automatic, semi-automatic and manual tools. The segmentation can then be used for volumetric analysis, density analysis, shape analysis etc. The software can handle a variety of data inputs from MRI, PET, CT, SPECT as well as histological and immunohistological stains.
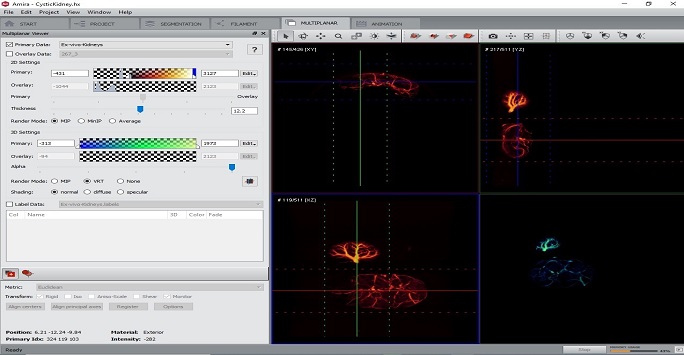
Figure 3: Screenshot view showing some functionalities of the Amira program. Example CT images of a mouse kidney imaged ex vivo are shown on the right showing multiplanar view and segmentation of the kidney vasculature
VivoQuant
Multi-modality post-processing suite for SPECT, CT, PET, MRI and Optical imaging data. File formats like DICOM, NifTI, and raw data can be used. It combines fundamental viewing functionality with tools for fine-tuning images, isolating and analyzing regions of interest, and much more. It allows multiple display modes including orthogonal, slice, co-registration views as well as 3D maximum intensity projection (MIP) and volume renderings.
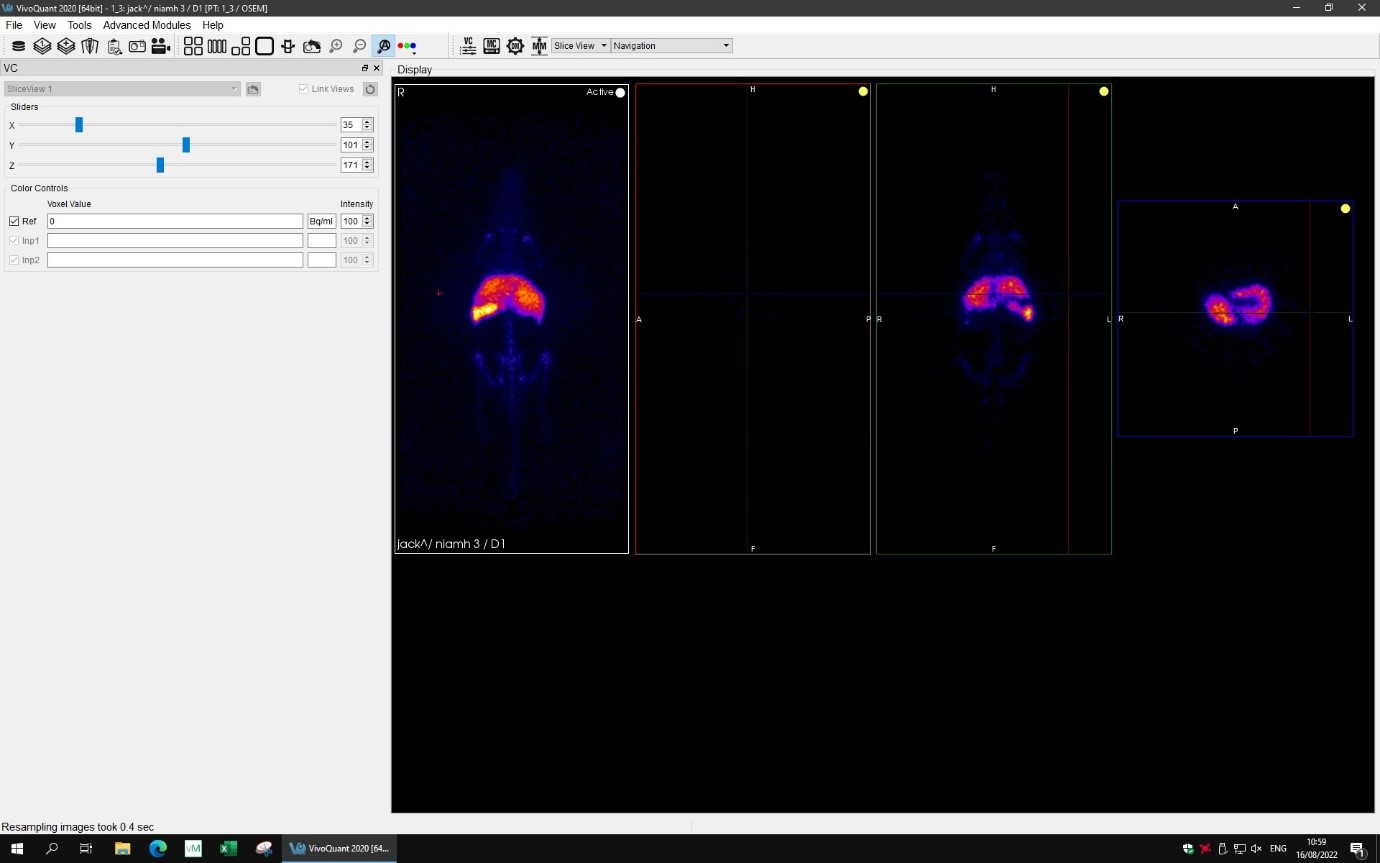
Figure 4: Screenshot image from the VivoQuant software showing multi planar PET image of a mouse injected with 89Zr-oxine labelled macrophages. High uptake of the labelled macrophages in the liver is clearly seen
viewMSOT 4.0
Software for analysis of multispectral optoacoustic tomography (MSOT) data for image reconstruction, spectral unmixing and image analysis. The processed data format can be exported to ImageJ (open-source software) as well for further analysis if needed.
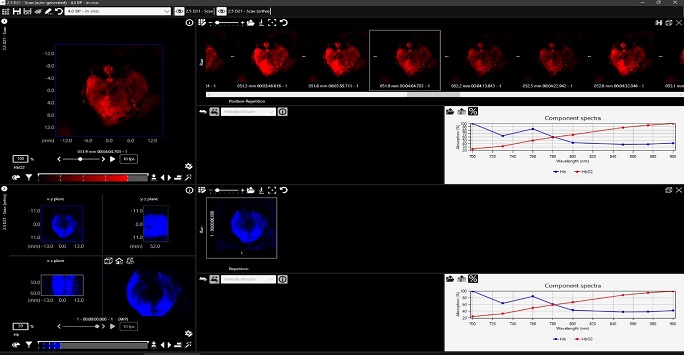
Figure 5: Screenshot from the viewMSOT program showing trans-axial photoacoustic images through a mouse abdominal area. Images and spectra in red and blue show oxy and deoxy haemoglobin concentrations respectively.
Living Image 4.7.3
Software for analysing bioluminescence and fluorescence data (2D/3D) acquired from the IVIS scanner.
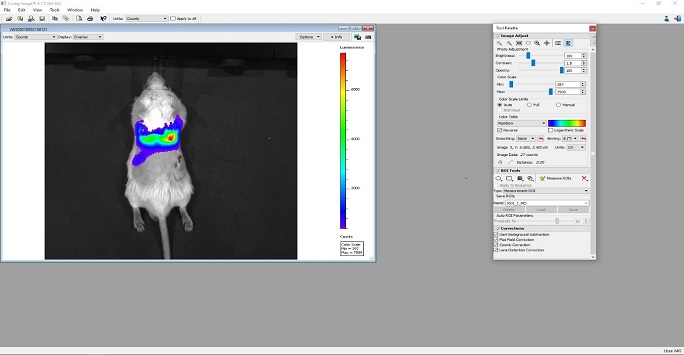
Figure 6: Screenshot of the LivingImage program showing bioluminescent images overlaid on the white light image of a mouse injected with luciferase positive mouse mesenchymal stem cells injected intravenously. After an intra-peritoneal injection of luciferin, the luciferase positive stem cells can be clearly seen from the lungs where they get trapped after intravenous injections.
Open-Source software platforms
jMRUI - 5.2
Software package for advanced time-domain analysis of magnetic resonance spectroscopy (MRS) and spectroscopic imaging (MRSI) data. Through a user-friendly graphical interface, biomedical researchers and clinical radiologists can use state-of-the-art signal processing algorithms to analyse and quantify spectroscopic data: from a single spectrum to a full multidimensional MRSI dataset.
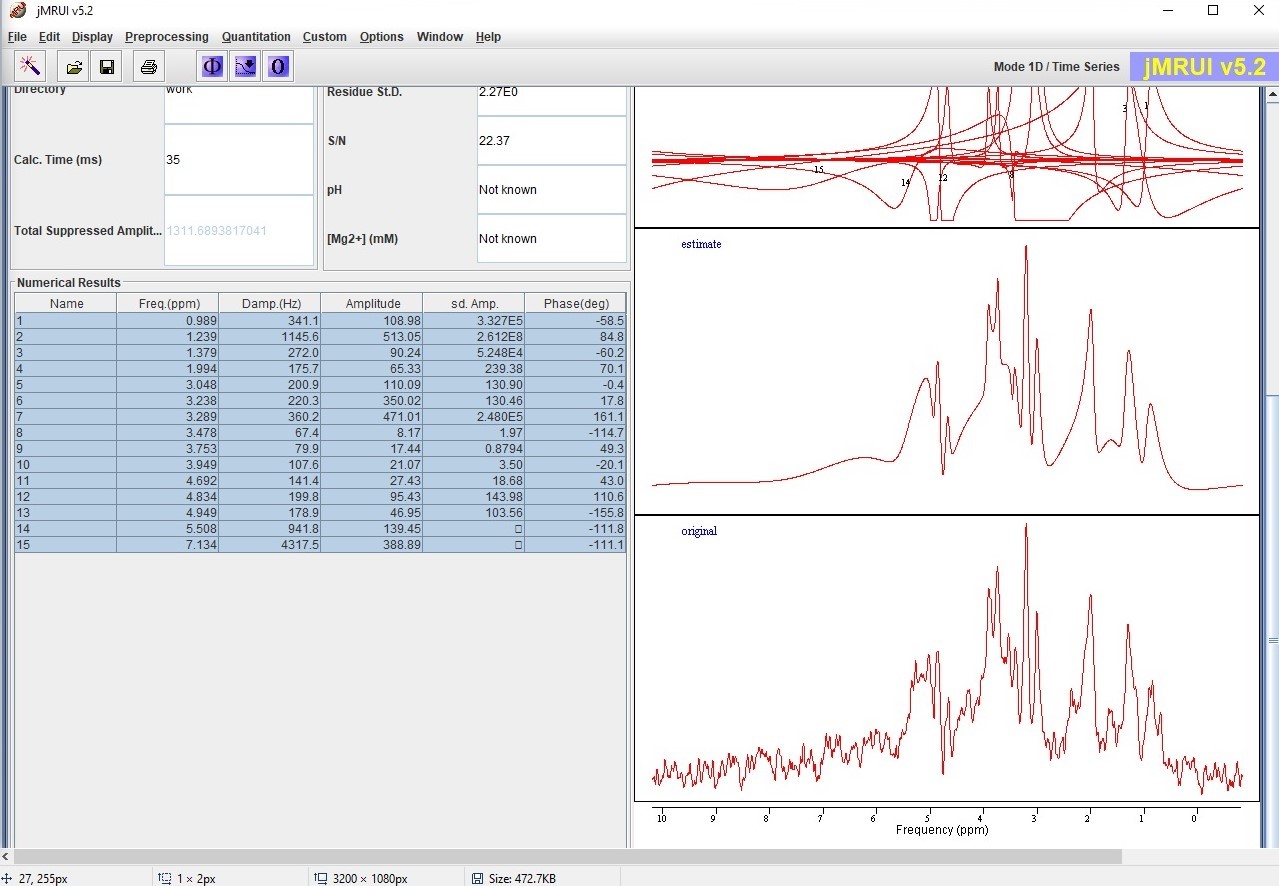
Figure 7: Screenshot from the jMRUI software showing the original raw (bottom) and fitted (middle) MR spectrum of a mouse brain tumour.
ITK-SNAP
Software application used to segment structures from bio-medical images. It provides semi-automatic segmentation, as well as manual delineation and image navigation. Core advantages include manual segmentation in three orthogonal planes at once, modern graphical user interface support for many different 3D image formats, including NIfTI and DICOM, support for concurrent, linked viewing, and segmentation of multiple images, 3D cut-plane tool for fast post-processing of segmentation results.
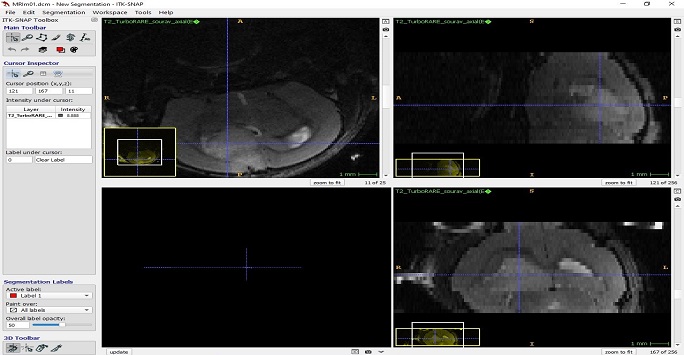
Figure 8: Screenshot image from the ITK-SNAP program showing multi-planar image of a mouse brain with a tumour. The blue cross-hairs point to the same co-ordinate indicating the tumour in all three images.
ImageJ
The world's fastest pure Java image processing program which can filter a 2048x2048 image in 0.1 seconds and can use imaging data from a wide array of applications. Several basic functionalities of image segmentation as well as quantification can be performed using this program.
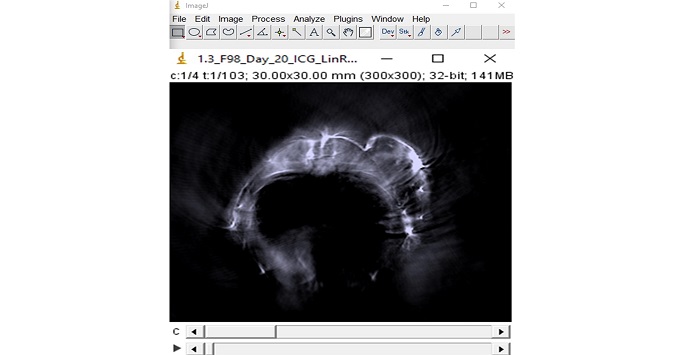
Figure 9: Screenshot from the imageJ program showing trans-axial photoacoustic image from the abdominal area of a mouse transplanted with a tumour subcutaneously. The tumour can be clearly seen with an intense signal in the periphery
3D Slicer
Open-source software to solve advanced image computing challenges with a focus on clinical and biomedical applications.
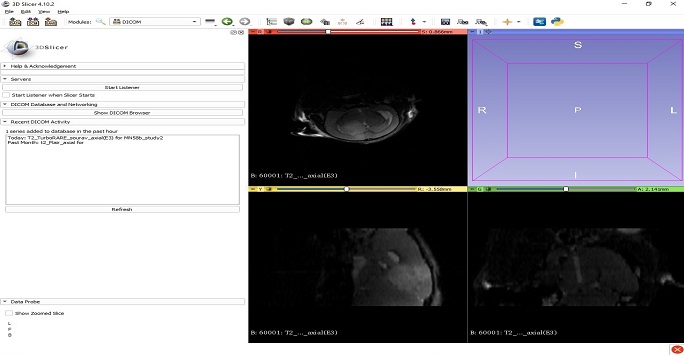
Figure 10: Screenshot from the 3D slicer program showing multi-planar T2 weighted MR images of a mouse brain with a tumour
Back to: Research