Mapping livelihood insecurity in Liverpool City Region
Posted on: 19 December 2025 by Roger Baxter in Blog
Roger Baxter, Heseltine Institute Policy Analyst, proposes a livelihood insecurity framework for identifying areas of intervention.
Why and how livelihood insecurity matters
For nearly a decade, University College London’s Institute for Global Prosperity (IGP) has worked with east London communities through citizen-led research to redefine and measure prosperity beyond jobs and income. IGP’s research shows that secure livelihoods emerge from the interaction of multiple assets, services, and social networks, which together can either enable or constrain people’s chances of leading a prosperous life (Woodcraft et al., 2021). This insecurity extends beyond income alone, encompassing the stability and adequacy of work, the affordability and security of housing, and access to essential services.
The Heseltine Institute first spotlighted IGP’s work on livelihood security in a 2021 Policy Briefing, presenting an alternative perspective on the underlying factors that drive a place’s vulnerability to economic shocks. These insights remain highly relevant as statutory Local Growth Plans, central to the Government’s growth mission, risk narrowing their focus to economic metrics at the expense of lived experience. This blog post revisits how this alternative framework might be applied in Liverpool City Region (LCR) to generate more nuanced, place-based intelligence that reflects the realities of communities.
Three pillars of secure livelihoods
IGP's research provides a useful framework for examining livelihood insecurity, through three fundamental pillars underpinning a secure livelihood:
- Secure income and good quality work
- Genuinely affordable and secure housing
- Access to key basic services
Using these three pillars (evaluated through analysis of ten metrics from publicly available datasets detailed below), we can assess how well different neighbourhoods in LCR support a secure livelihood. If any pillar is weak, for example, if an area has plenty of jobs but unaffordable housing or poor transport links, residents may still face insecurity. The IGP framework thus encourages a comprehensive look at prosperity, not limited to income levels alone.
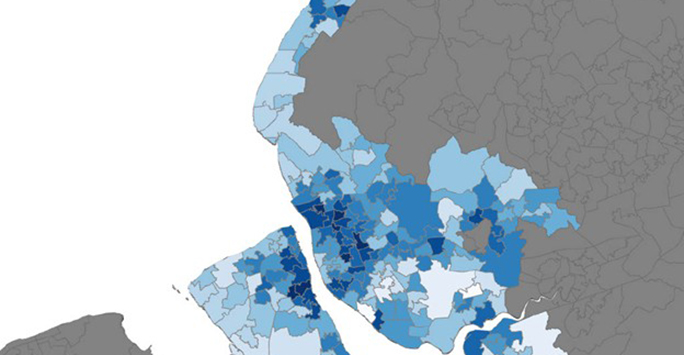
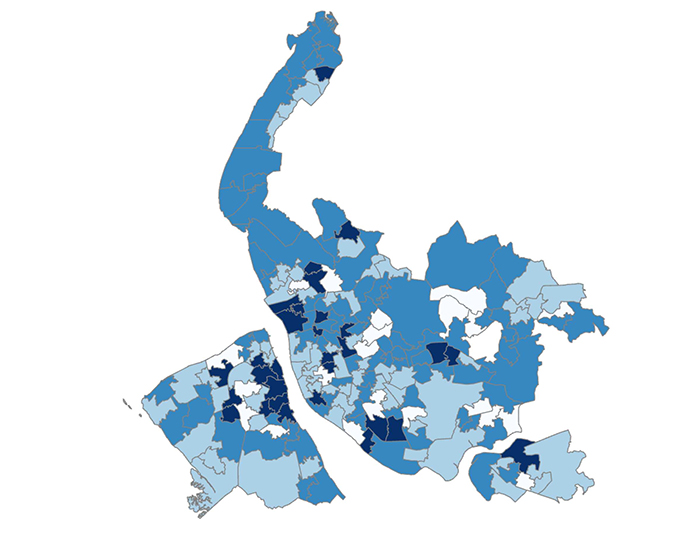
Applying this framework in LCR reveals clear patterns of compounded disadvantage. Mapping indicators for each pillar across Lower-Layer Super Output Areas for the region (LSOAs) shows insecurity is widespread, not confined to a few hotspots. Some neighbourhoods face challenges across all three pillars, producing a different picture from the 2025 Indices of Multiple Deprivation (IMD). In these areas, households often bear a triple burden: low incomes, high housing costs, and gaps in basic services or infrastructure. Such overlapping issues can trap communities into a cycle of hardship, as difficulties in one domain (like low income) intensify problems in others (such as falling behind on rent). The maps illustrate this, with darker blue indicating lower livelihood security and lighter shades signifying higher:
Figure 1: Livelihood insecurity in Liverpool City Region (all domains) (Credit: Roger Baxter)
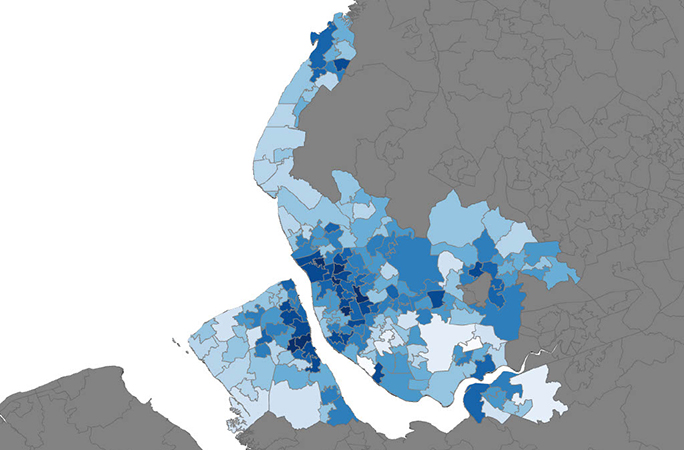
Figure 2: Livelihood Insecurity Pillar I – Secure income and good quality work (Credit: Roger Baxter).
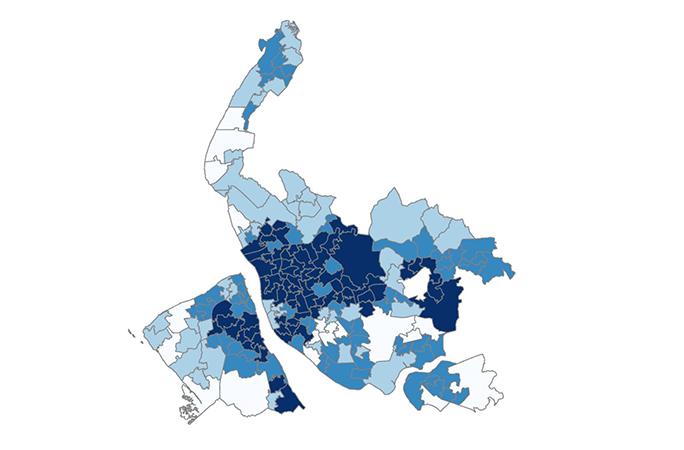
Figure 3: Livelihood Insecurity Pillar II – Genuinely secure and affordable housing (Credit: Roger Baxter)
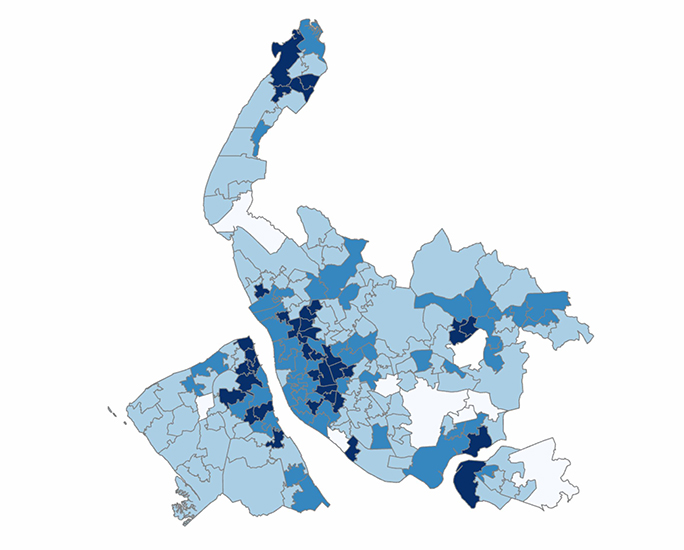
Figure 4: Livelihood Insecurity Pillar III – Access to key basic services (public transport, internet, and childcare) (Credit: Roger Baxter)
These maps represent LSOAs in the Liverpool City Region, and were formulated using data from several publicly-available sources: ONS Income Estimates 2020/21; ONS Census 2021 (economic inactivity); DWP Children in Low-Income Families; ONS Household income after housing costs modelled data; DLUHC EPC database; Department for Energy Security & Net Zero (2021 fuel poverty statistics); OFCOM/ONS digital exclusion data; and ONS population data (children under 4).
This mapping underscores that livelihood insecurity is nuanced and multi-faceted, shaped by intersecting factors rather than single indicators of poverty. Areas most insecure typically face multiple stresses, whether in city centres or outlying estates. By visualising all three pillars together, policymakers can pinpoint where disadvantages converge and design targeted interventions.
Beyond deprivation indices: adding new insights
It’s important to note that this approach complements existing tools like the UK’s IMD. The IMD is the most well-known tool for identifying disadvantaged areas using a broad basket of indicators. Indeed, many places highlighted by the livelihood insecurity maps correspond to neighbourhoods long recognised as disadvantaged in official statistics. This illustrates the accuracy of the livelihood insecurity framework in identifying areas in need of intervention. However, the livelihood insecurity mapping adds new value beyond the standard indices.
Firstly, by breaking down insecurity into specific pillars, it provides more granular insight into what drives hardship in each area. Traditional deprivation rankings can tell us that a place is struggling, but do not always give a clear and composite picture as to why it might be struggling in a particular area. In contrast, a pillar-based map can reveal if a community’s biggest gap is jobs, housing, or services, making it easier to design targeted, actionable solutions.
Secondly, an approach based on livelihood security will be inherently people-focused and current, as it is able to capture dimensions (like secure work or access to childcare) that resonate with lived experience and are often discussed by residents themselves. By emphasising these factors clearly, the approach encourages policymakers to address specific barriers holding people back, away from only alleviating “deprivation” to proactively building the infrastructure of prosperity.
Towards a Liverpool Co-Prosperity Index
The insights from this mapping exercise point toward a larger opportunity: developing a Liverpool Co-Prosperity Index. Inspired by the IGP’s work in east London, this approach would capture what residents value most for a good life, revealing trends that traditional metrics often miss. In doing so, the Index would send a clear signal that Liverpool City Region is committed to prosperity for all its communities and reinforce that the aim of its Local Growth Plan to provide inclusive growth is a clear priority. Co-designing the index with input from local stakeholders including universities, policymakers, and community groups would ensure it reflects lived experience and guides inclusive growth. As a next step, convening stakeholders to define core indicators and governance for the index could lay the foundation for a practical, forward-looking measure of shared prosperity.
Keywords: growth.