Image gallery

The images below are all from our facility and show the full range of our technical abilities.

All images are copyright of users of the Biomedical EM Unit. Permission to reproduce images may be requested by contacting us.

Click on the thumbnail images below to download a high resolution version of the image.
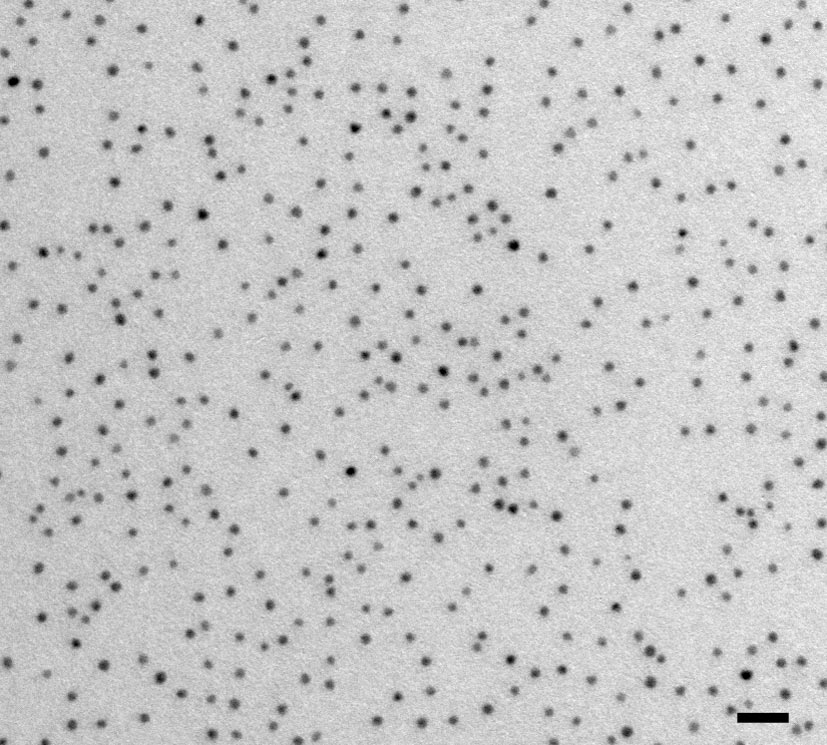
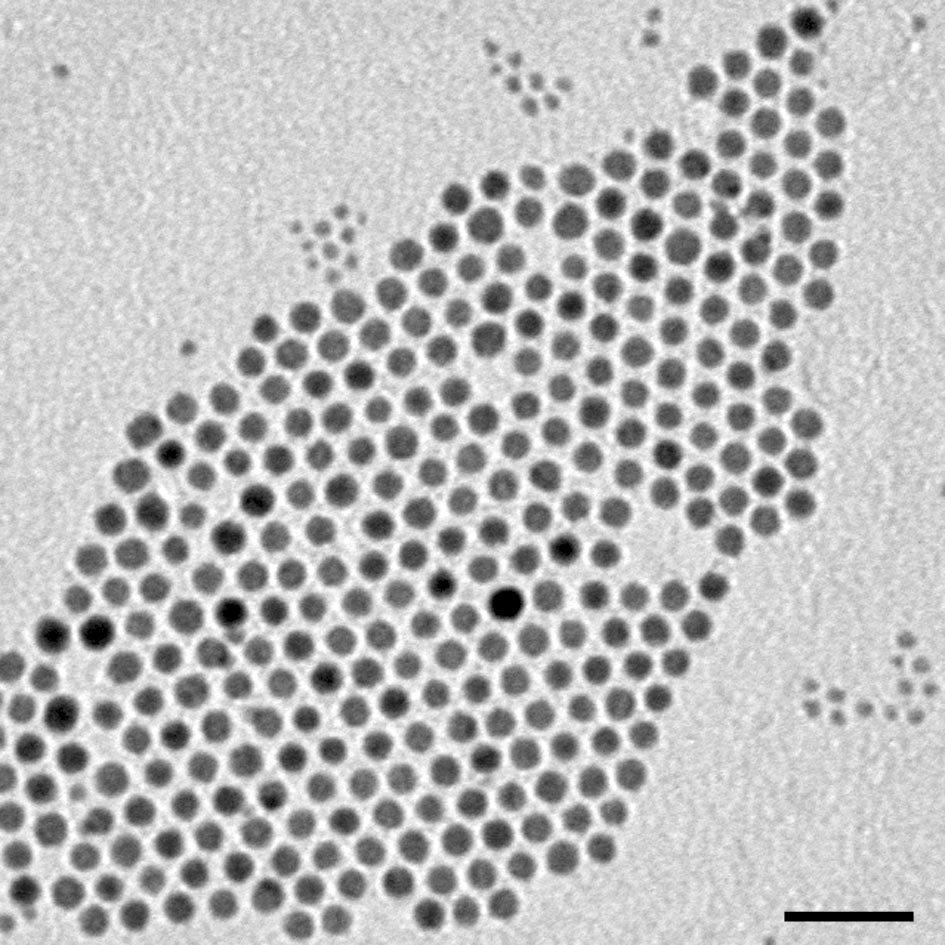
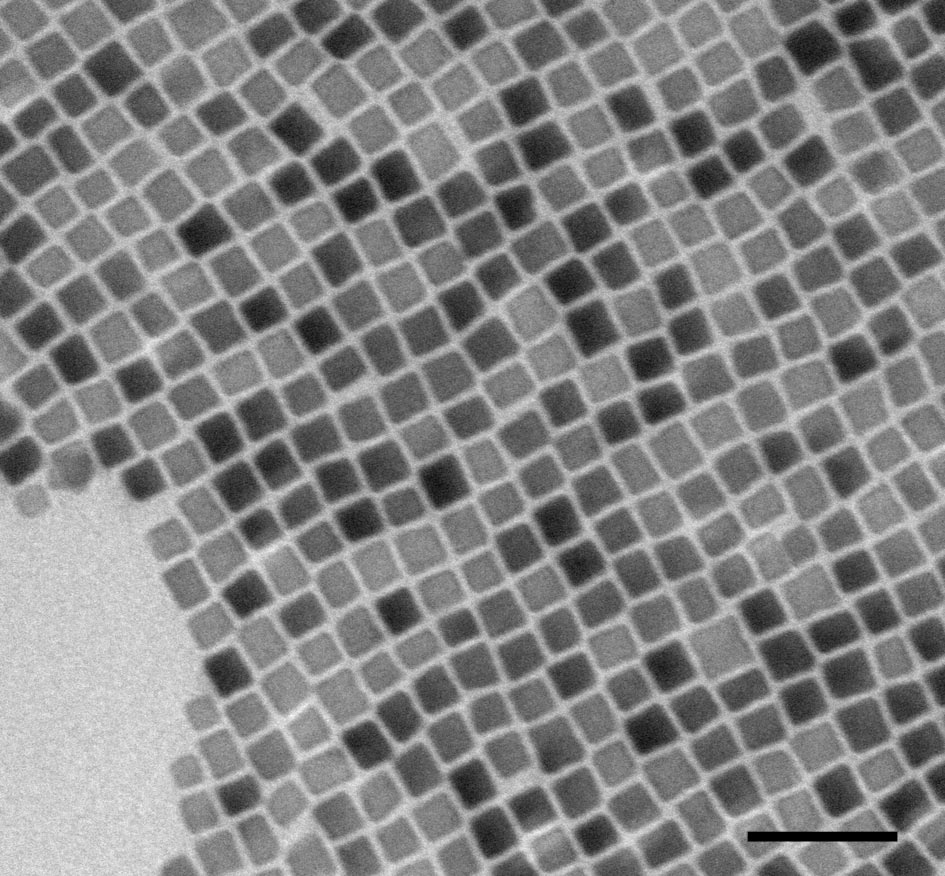
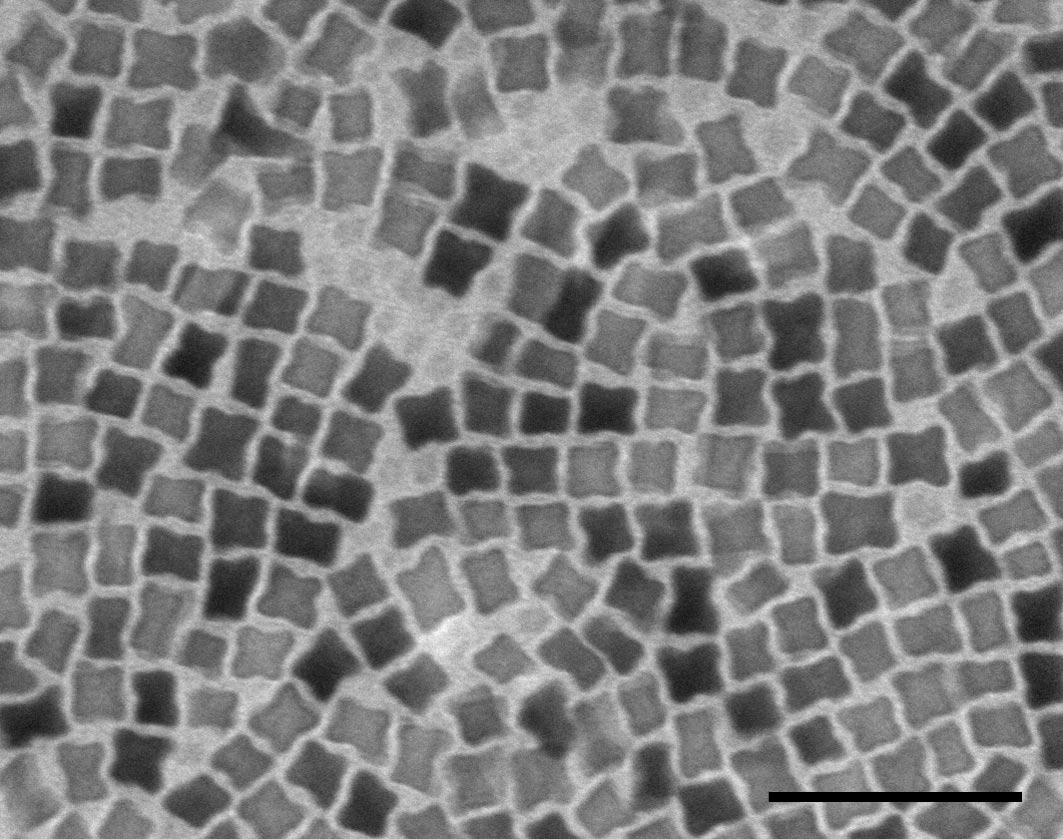
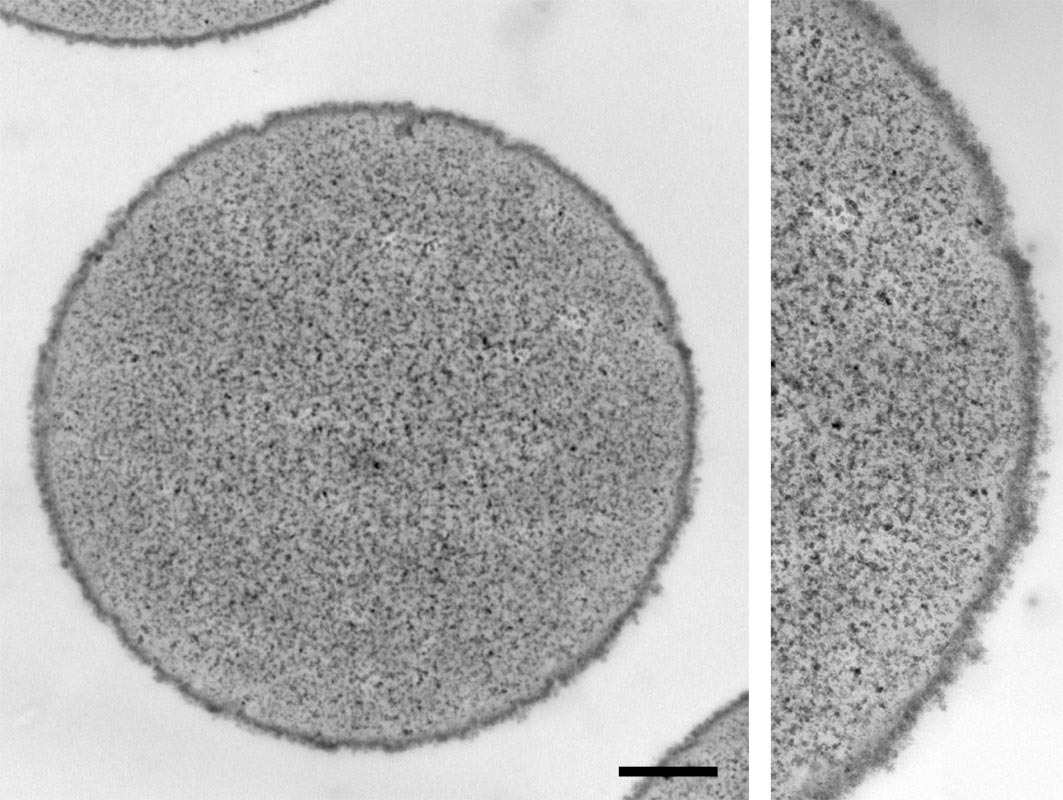
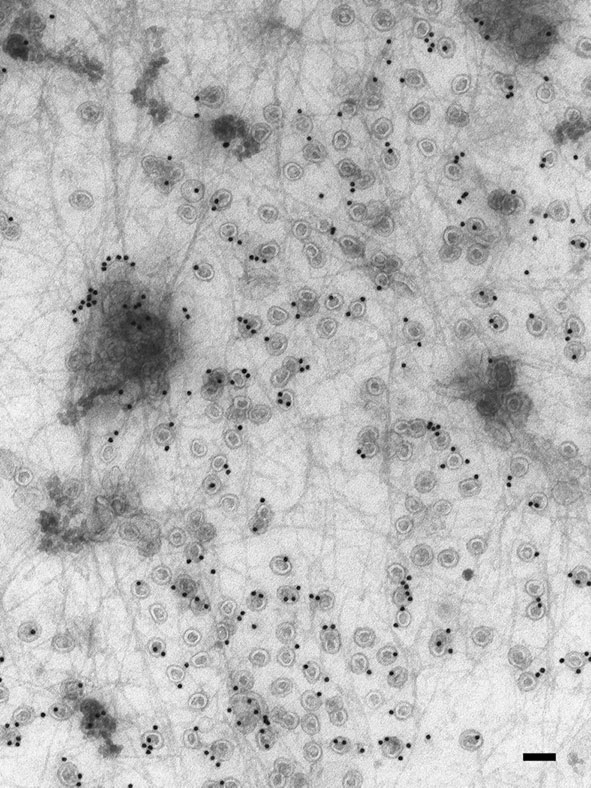
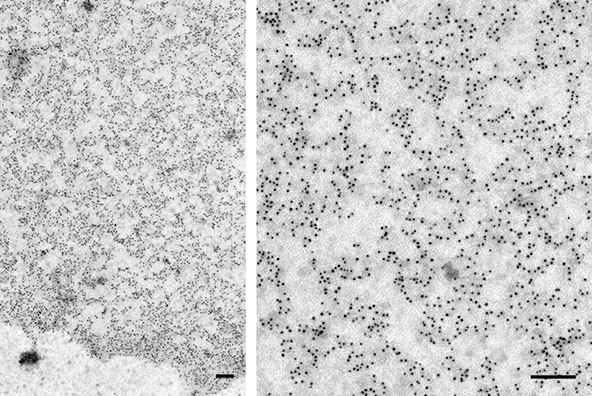
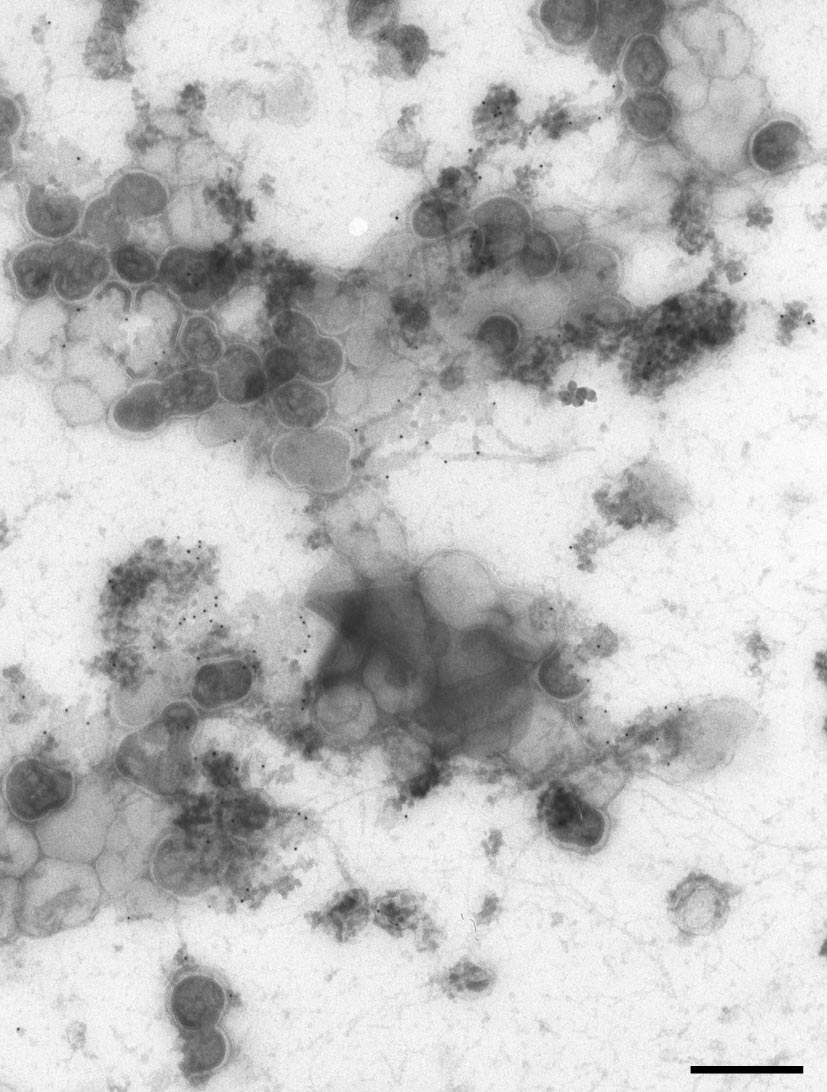
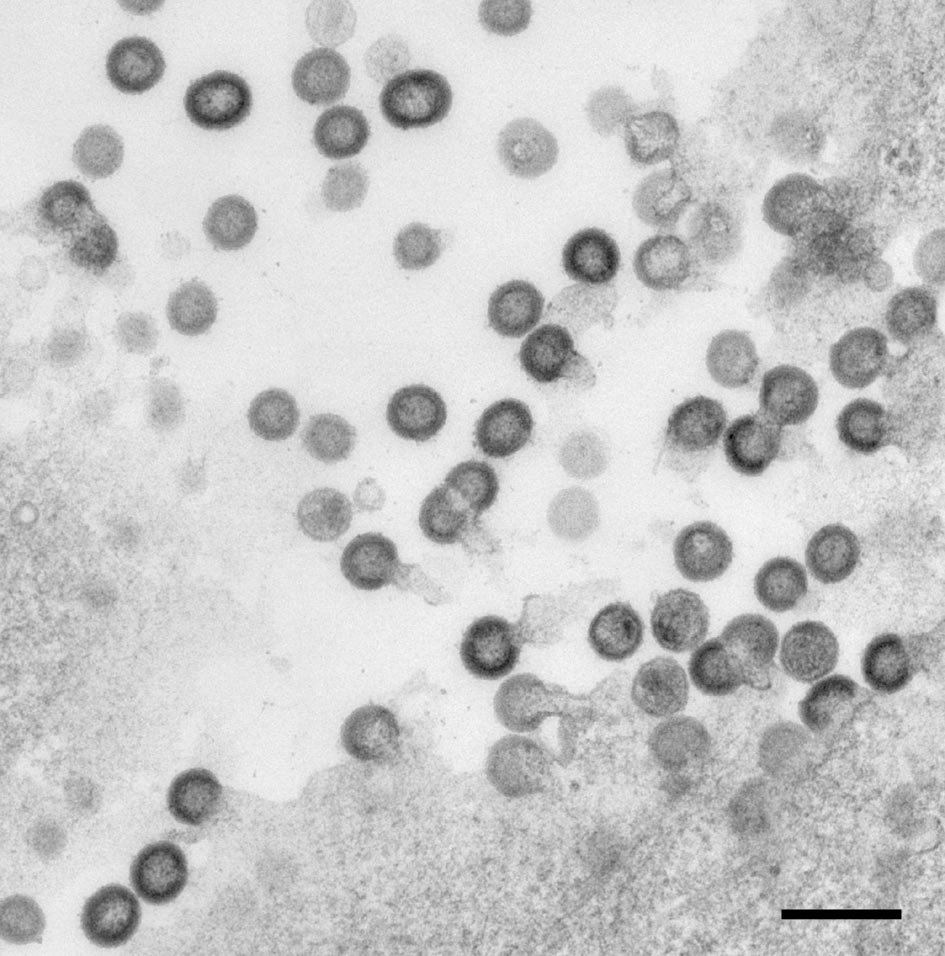
Nanoparticles

4-6nm antibody-conjugated colloidal gold purified on a sucrose gradient. Bar = 50nm.
5nm and 12nm gold nanoparticles. Bar = 50nm.
Cubic binary nanocrystals. Bar = 50nm.
Star-shaped binary nanocrystals. Bar = 50nm.
Magnetic bead coated with layers of 10nm quantum dots. Bar = 500nm.

Cell biology

Section of a whole fibroblast cell showing nucleus, mitochondria, endoplasmic reticulum (ER) and endosomes. Bar = 500nm.
Cellular organelles: nucleus, nuclear pores, Golgi, rough ER (RER), mitochondria, tubular endosomes, lysosomes. Bar = 500nm.
Multiple Golgi complexes in primary human fibroblast cell. Clathrin-coated vesicles can be seen budding from trans (top) faces. Bar = 500nm.
Late endosomes and lysosomes showing typical multilamellar and multivesicular structures. Bar = 500nm.
HIV accumulates in HeLa cell endosomes in the absence of the accessory protein vpu. (Harila K et al, 2006). Bar = 500nm.
ER, Golgi, late endosomes and mitochondria are typically found in the peri-nuclear region of the cell. Bar = 500nm.
Pancreatic acinar cell undergoing compound exocytosis. Lots of RER and secretory granules. Bar = 500nm.
RER. Individual ribosomes decorating the tubular surface can be seen. Bar = 50nm.
Endosomes tethered together in UBPY knockdown HeLa cells. (Row PE et al, 2006). Bars = 50nm.
Centrosomes organise microubules. In this pre-mitotic cell they sit in the nuclear cleft surrounded by ER, Golgi and endosomes. Bar = 500nm.
Kinetochore. During mitosis, sister chromatids are separated by microtubules that attach at the kinetochores. Bar = 500nm.

Plasma membranes

Caveolae and actin cytoskeleton on 2D flat sheet of plasma membrane. See method. Bar = 100nm.
Caveolae and actin cytoskeleton on 2D flat sheet of plasma membrane. Bar = 100nm.
Lipid rafts. Immuno-gold labelling reveals cell surface clustering of cholesterol-sensitive nanoclusters (Prior IA et al, 2005). Bars = 100nm.
Ultrathin section containing 2D view of basal HeLa plasma membrane. See clathrin-coated vesicles and protein complexes. Bar = 500nm.
A7r5 cell interconnected caveolae. Ultrathin section containing 1D view of plasma membrane. Bar = 100nm.
Whole T-cell basal plasma membrane sheet showing highly clustered microdomain gold probe. Bar = 500nm
Whole T-cell basal plasma membrane sheet showing highly clustered microdomain gold probe. Bar = 500nm.
HeLa cell Gag (HIV protein)-induced viral like particles on 2D plasma membrane sheets. Bar = 500nm
HeLa cell Gag (HIV protein)-induced viral like particles on 2D plasma membrane sheets. Bar = 500nm.
HIV Gag protein induces viral-like particles that bud from the HeLa cell surface. Bar = 500nm.