The space time calendar: new paper published in geographical analysis
Earlier this month, Geographical Analysis published a paper I had been working on with my colleague Emmanouil Tranos for quite some time and that I am very excited about. The paper is entitled “Characterizing the Spatial Structure(s) of Cities “on the fly”: The Space-Time Calendar”, and it has two key ambitions. First, it is a contribution towards building a spatial analytical toolkit that bakes right into its core some of the distinctive characteristics of new forms of data such as high frequency (the velocity v). Second, the paper proposes a specific approach, the Space-Time Calendar, to explore urban fast and slow dynamics in a visual way.
Start with the broad ambition. In the last few years, a new breed of data sources have started popping up and becoming available to urban scientists, from transit feeds to cell-phone records, and everything in between (have a read at my other paper on this if you are interested). These present an awesome opportunity to measure, analyse, and understand how cities work and how many of the processes that take place within them develop. However, “new forms of data” are really new when compared to traditional sources such as official surveys. One of these differences is in the frequency and spatial, temporal, or spatiotemporal resolution. In our paper, we use data from a mobile phone operator which provides a measure of activity at a small area level, every hour, for over two years. Contrast this with a Census, which comes once every ten years. Surely the methods we have developed over decades of work in statistics and spatial analysis will at best struggle to cope with the nature of these data. Which is why, in this paper, we develop a new approach to explore large datasets with high frequency and spatial resolution: the Space-Time Calendar.
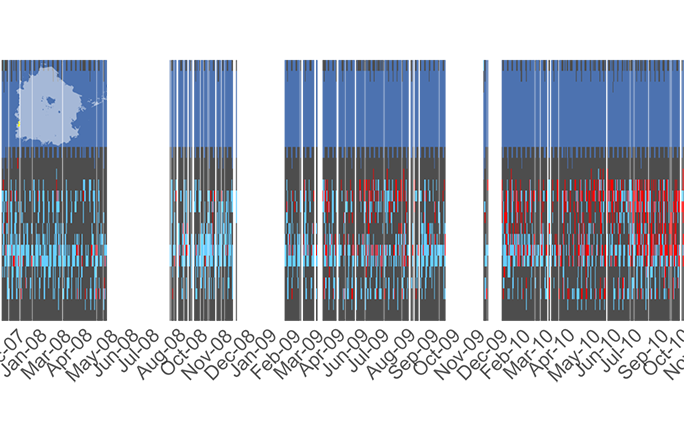
The idea of the Space-Time Calendar came from the need to visualize change in spatial patterns over a large number of time slices. In the old days, when studies were limited to just a few points in time (e.g. three or four Census years), one could simply make a single map for each year, and compare them visually. As soon as we have more than just a few, this approach starts to break: maps from one hour to the next are probably rather similar, but changes will occur “in the margins” (e.g. an area becoming a hotspot, another one dissapearing). Picking this up becomes thus very hard from a sea of roughly similar but not identical maps. The beauty of the Space-Time Calendar is that it focuses the attention exactly on this kind of changes and makes it very explicit through the (borrowed) concepts of slow and fast dynamics. Our solution is able to characterise the fast rhythm of cities (those patterns that occur within every day), but also to show how this structure evolves over time (along a slower dimension). In doing so, this approach opens the door for an almost real-time monitoring of cities, where one can capture, visualise, and act on changes at the same pace they happen. This is very exciting for everyone who cares about cities, their planning, and their management.
If this has been enough to wet your appetite and make you want to know more about Space-Time Calendars, here are the key links to the paper and its content:
- Published version in Geographical Analysis (paywalled).
- Accepted version stored at the University of Liverpool.
- Code repository at Github.
- SSRN Abstract.