Alberto Acuto presented at online Virgo Consortium Meeting 2021
Despite these unusual and challenging times, the science has not stopped and the annual gathering of the Virgo Consortium was held online, with more than 100 researchers connected worldwide.
The ‘Virgo Consortium’ is a gathering of scientists that work on galaxy formation and simulations. During the years they have proposed and created many of the most accurate Astrophysical and Cosmological simulations such as EAGLE, BAHAMAS, Millenium, IllustrisTNG. These simulations have forwarded our understanding of many phenomena that drive the formation and evolution of the Universe. They meet once a year and discuss the latest development and the next steps to take for these topics.
This year’s meeting in January 2021 was shorter and more oriented to open discussions. From the several topics discussed some were really far-reaching such as machine learning tools to improve large-scale structure predictions, data stream from simulations, new hydrodynamical codes and solvers (SWIFT and Gadget4) and updated feedback for galaxy formation (especially black holes winds and jets).
LIV.DAT student Alberto Acuto, based at the cosmology group at Liverpool John Moores University (LJMU), presented a short talk where he discussed his latest results from the project he is currently completing: The characterization of the ‘halo model’ by making detailed comparisons with the BAHAMAS simulations. The presentation was focused on the development of tests on this analytical tool. It also showed comparisons with the cosmological simulations to understand how the mass definition impacts the ability of this model to recreate, to a reasonable agreement, the expectation to do precision cosmology with large-scale structures.
Alberto commented: “At this stage of PhD career we must grab every chance we have to discuss and meet with other people and this meeting was almost a unique opportunity. I felt that the audience was engaged by the findings and the methods that we applied and they were keen on discussing several related topics. After many months away from the ‘conference feeling’ it was nice to engage again with many researchers and discuss science freely. A little throwback from ‘what we were used to doing’”.
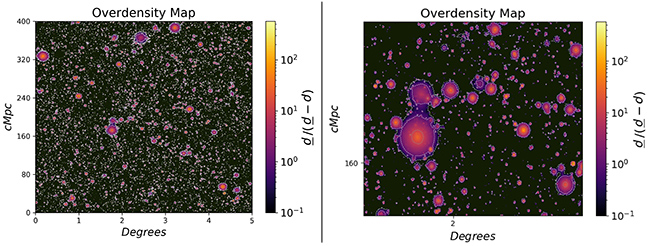
The figure on the left shows a map that outlines the matter overdensities i.e. galaxies and groups of galaxies, with the different mass definitions highlighted using grey lines. The figure on the right shows an area zoomed in on a dense region where you can appreciate the lines determining the mass overdensity. The different mass definitions are used to see how well we can map the matter distribution in the Universe.