Crowd Sourced Charts; History of amateur surveying
Overview:
I use a leisure-grade sonar and GPS to combine depth and position.
I have two different objectives
Equipment:
Some amateur surveyors have used a tender/dinghy for surveying to get
to shallower water without endangering their main vessel. MARLIN is a
tough workboat and can take the ground - and I prefer to explore in the
comfort of my wheelhouse. Also because of the big tidal range in my
area (over 10m), I can safely explore areas at high water that will be
drying at low water.
I use a Humminbird 898c SI sonar which has an external GPS antenna.
This sonar has side-imaging (SI) which I have found to be difficult to
use effectively in a marine environment (waves, current, turbid
water,..). I have built a bracket to hold the SI transducer on a pole
at a suitable depth over the side of MARLIN.
For maximum convenience I have also installed a conventional (puck)
transducer which shoots through the (GRP) keel of Marlin. The GPS antenna
is arranged directly above this. This can be used easily in any weather
and while retrieving divers,.. (though note that bubbles rising from
divers can pollute the sonar signal).
The Humminbird has a separate SD card slot for storing data and
this allows sonar traces and GPS information to be saved every few
seconds. I take this SD card home and process the data on my (Unix)
laptop using codes I wrote myself.
Accuracy
Latitude and longitude are accurate to around 1 metre (s.d. value)
and depth is accurate to around 0.1 metre.
Attention must be paid to latency: depth and position information
logged to the SD card are at slightly different times.
With a 200 MHz sonar transducer, Humminbird quotes a 20° cone
angle for -10dB reduction. It is usual to quote cone angles for an
intensity reduction of -3dB, then the transmitted beam cone angle is
11°.
In practice, receiving the return signal will significantly reduce the
spatial response region (to an 8° cone). This covers, for example,
a region of diameter 2 metres at 14 metres depth. This smears the
return from isolated or abrupt sea-bed features.
Altitude (see below) is less accurate but can be obtained to
better that 1 metre by averaging over a long time period.
Tides:
Depth information needs to be evaluated relative
to a useful datum: chart datum (CD) on hydrographic charts. This can be
achieved by using the (freely available) raw tide
gauge data (taken every 15 minutes at locations: Liverpool,
Llandudno, Holyhead, Heysham, Workington,..) and quoted relative to CD.
Tidal time differences to these ports are also needed for other locations
than these ports.
The chart datum is given relative to Ordnance Survey datum (OD)
(basically 0.2m below mean sea level: MSL) for ports on Hydrographic charts and
more information can be obtained from the Admiralty Tide Tables. Note
that in a tidal river estuary, the chart datum changes considerably as
one heads inland.
[also the tidal height prediction becomes less reliable].
Chart Datum (CD) is basically specified to be at a level
reached only by the Lowest Astronomical Tide (LAT). This is the tide
that has the largest range (from HAT to LAT), theoretically. In
practice, non-astronomical factors such as winds and air pressure can
cause tide levels higher than HAT and lower that LAT.
A GPS gives altitude relative to the WGS84 ellipsoid. This can be
related to MSL using the OS website OSGBN02
model. The altitude accuracy is usually worse (in metres) than that of
latitude and longitude. However it is possible to average altitude over
a period (say 15 minutes) since the sea-level changes quite slowly. I
have explored this as a method to "act as my own tidal gauge" but found
the resulting accuracy insufficient. Another drawback is that the
Humminbird only outputs altitude information as NMEA so a
computer/logger is needed to log it.
Codes:
The SD card can be analysed off-line. The data are stored in a
binary form but this can be read and interpreted. I have written my own
codes to do this (shell scripts plus Fortran 90 code).
Sonar information: the sonar trace is saved, so that one can
reconstruct the "moving window" display as seen at sea. This is useful
to look for anomalies, wrecks,... The Side-Imaging display (if stored)
can be rerun also. The SD card also saves the depth determined by the
Humminbird control head. This is usually reliable, except in shallow and
or turbid water. Having data available from future as well as past
times, one can re-analyse these traces to obtain optimum depth values.
For shallow water, I smooth the data over time, and over depth
(since the sonar ping corresponds to an extent in depth) and then
determine the location of the sea-bed. After checking that these depths
are reasonably continuous in time, I get a robust depth value.
For ship-wreck studies, the sonar return at each time is explored
to find the shallowest signal (top of wreck) and these values are then
checked for reasonable consistency in time.
Position: The Humminbird unit exports to the SD card the latitude and longitude in Navionics format. (Navionics charts are the default chart displayed). These are integer values in "mercator metres": a "mercator metre" roughly corresponds to 0.6 metres at UK latitudes. [See GPSBabel module humminbird.c for more details.]
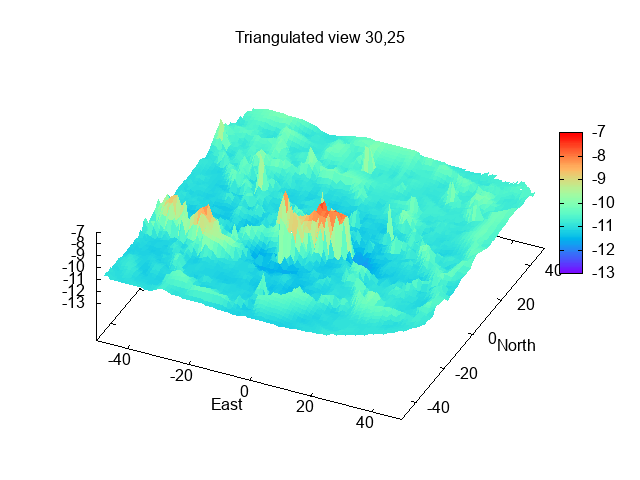
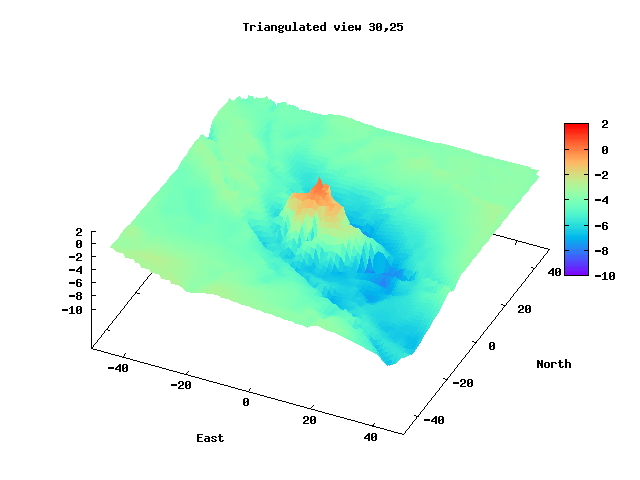
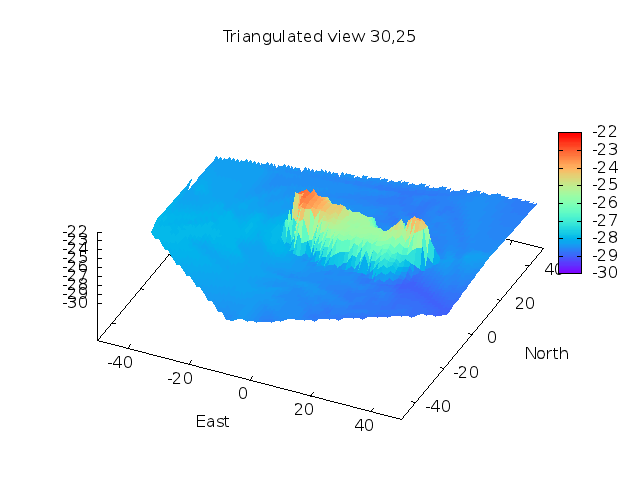
Mapping: combining the position and depth information gives a 3-dimensional representation of the sea-bed. I prepare files to be displayed by various Gnuplot options. The data taken will lie on a curved line (the vessel's track) and one can check (after tidal correction) for consistency when the line crosses itself in position. To interpolate between the track segments, I use a triangulation (Delaunay triangulation) to cover the area. This allows 3-dimensional images and also allows contours of constant depth to be determined.
Examples:
Three dimensional images of wrecks (scales in metres):
Calcium ;
Tug Nelson;
Alarm ,
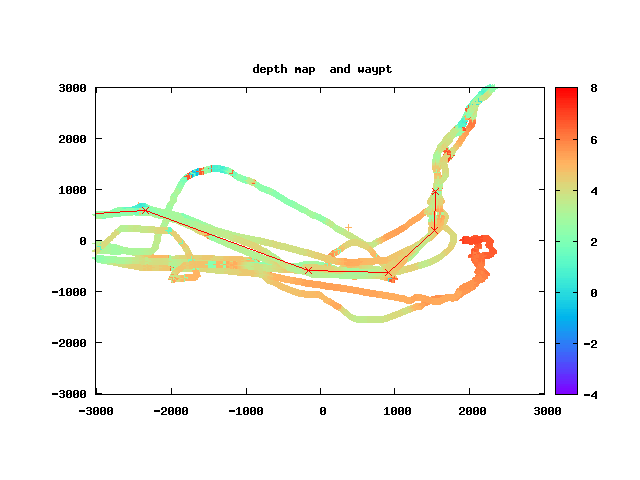
Depth tracks (scales in metres)
Upper Mersey.
TeamSurv: I have submitted a lot of data to
TeamSurv which is freely available with graphical display. They
correct the data for tidal height and present it as tracks with spot
depths. They show drying heights on sandbanks also. In some areas (S of
England) there is sufficient data that they can present a chart with
depth contours.
[I note that up tidal rivers, the chart datum varies and also the tidal
height prediction becomes less reliable: TeamSurv is still working on this].
[As of 2019-2020, Teamsurv seems to have stopped updating their displays]
Navionics: I have submitted data to Navionics for use in
their SonarChart crowd-sourced addition. Much of my data was in shallow
water and so above CD (LAT). This they initially showed as a narrow
strip crossing a drying area (which is a sensible way to treat depths
along a track). Later versions just ignore this data: they fix the
shape of the drying areas (above CD or 0 of depth) as given by the HO
and just add extra contours in areas below this. Their extra contours
seem to be evaluated by interpolation keeping the zero-depth contour
fixed. This is not a reliable procedure in an area with sandbanks and
channels that move from year to year.
Even worse; I have noted that the SonarChart addition sometimes
interpolates an earlier version of the HO chart than their "Navionics"
version: so SonarCharts are actually more out of date.
I stopped submitting data to Navionics - since their treatment of
sandbanks in an area of big tidal range is not adequate.
After discussion with Navionics - they admit their current
offering has the limitations I presented above, but are planning to
improve their product and will use all submitted files to achieve that.
So I am now sending them data again.
I now also have a Raymarine MFD which can display charts. It can
accept depth data (from Humminbird unit) by NMEA and has its own
(internal) GPS. I experimented with Navionics Sonar Chart Logs - which
are stored as .sdf files on the Navionics card in the MFD. This stores
lat, long, depth and time but in a proprietry format (compressed binary
by the look of it) which I cannot read.
I prefer to store data in a manner readable by me - so continue to
use NMEA log and Humminbird stored track and sonar record.
Another Navionics option (available on the Raymarine MFD) is Sonar
Chart Live. This stores depth (with option to correct it tidally within
the MFD), lat and long. The files are stored on the Navionics card in
lsdcache as .lsd files. This data is displayed on the MFD (in real time
plus previous data). A single track is shown as a 50m wide swathe.
Multiple tracks nearby allow contours to be drawn (depth interval
between contours is selectable).
I have checked this out myself and the contours agree well with my
own codes using my data and tidal corrections. In the case of an
isolated wreck - the Sonar Chart Live smooths out the peak of the wreck
- presumably because of a bias towards suppressing spikes in depth
sounding records.
Three features currently lacking which would be useful
are (i) ability to display contours of drying areas (above CD) (ii)
ability to enter a depth offset (eg transducer to waterline) and (iii)
ability to display existing data without overwriting it with new data.
These .lsd files are binary files (uncompressed) which is an
efficient way to store data and I have worked out how to read/write them
myself. This provides a way to present my own data files on the
Raymarine MFD. At present the limitations of Sonar Charts Live mean that
I have to add 10 metres to depths (effectively using a new chart datum
10m above the real one), so as to be able to display drying areas.
I have also investigated whether Sonar Chart Live .lsd
files are still displayed after the Navionics "Freshest Data" has
expired. Indeed contours (at 2m separation) are displayed with 0%
transparency - but (for Raymarine MFD) with no option to change
transparency or contour separation or turn off SCL (except by
deleting/renaming the .lsd files).
Also:
For other "DIY" surveying examples see
Antares and
Mother of Perl[link broken].
There is quite a tradition of amateur (or self-taught) surveying of the coast of Wales.
Lewis Morris was resposible for the first detailed charts of the North Welsh coast: see here for more about his Plans of harbours, bars, bays and roads in St. George's Channel of 1748.
A later important input was from F.H.(Henry) Glazebrook who sailed from the west coast pf Anglesey in his 14ft boat MERMAID and lovingly charted every rock and recorded every eddy and inshore passage. His legacy is the Anglesey and North Wales Coast Pilot (1961).