Notes on survey results and tidal corrections.
Summary: Cheese Rock stands about 1m proud of the surrounding seabed and at LW spring slack, clearance over it is more than 2m. (Do not rely on these results - check yourself).
17 August 2016 8:25-9:24am [also earlier date see below]
Tides:
Liverpool (Gladstone) HW 8.7m 11:16; LW 1.8m 05:41 (Spring Range 9.0m)
[Note Gladstone HW is 5 minutes earlier than Alfred which was
historically used]
Swellies slack expected HW (Gladstone) -1:45 = 9:30.
Holyhead HW 5.3m 10:34 [tide gauge result actually used]
Port Dinorwic (PD) Range as Holyhead; 20 mins earlier (Spring Range 4.8m)
Pwllfanogl (PF) HW time similar to PD (Spring Range 5.8m)
Menai Bridge (MB) HW approx 45 minutes after PD (Spring Range 6.7m)
Observations:
8:39am depth 6.0m centred 53 12.973; 4 10.988
about 4m wide E-W rising 1m from seabed.
8:54am depth 6.1m centred 53 12.970; 4 10.990
about 3m wide E-W rising 1m from seabed.
These times are 40 and 35 minutes before HW slack (circa 9:30am)
Tidal correction:
PD: Use Holyhead tide gauge (20 minutes earlier) interpolated:
Reduced depths: 1.3m and 1.2m resp. [used for graphics]
PF: Use larger Pwllfanogl range instead: so tide model is
(PD-ML)*1.2+ML. Here mean level ML = 3.2m at PD and ratio is
spring ranges (PF from Goddard 5.8m divided by PD of 4.8m).
This range also agrees with that obtained from the Bangor University
Menai model illustrated previously.
Reduced depths: 1.0m and 0.9m.
Presumably CD(Chart Datum) at Pwllfanogl should be chosen lower
than at PD, namely 1.2*2.92=3.5 to account for the larger range. (CD
below OD: PD 2.92m; MB 3.78m; CD should be LAT approx)
This would decrease charted depths by the CD difference of 0.6m to
give depths at LAT of 0.4 and 0.3m respectively, values close to the
0.4m indicated on the HO chart.
LW slack. Actually what is of most relevant is an estimate of
depth at LW slack rather than at LAT. Since MLWS is about 0.7m above
LAT at PD and MB, then the clearance at LWS would be 1.1 and 1.0m. Now
LW slack is earlier than LW and so the tide level will be higher still:
approximately 0.9m more in the Cheese Rock area: so clearance would be
about 2.0m.
As CHT(Caernarfon Harbour Trust) makes clear, the tide level will
be falling quite fast around LW slack. In the hour before it will have
fallen 1.5m (springs) and 0.8m (neaps). So arriving before LW slack will
further increase the depth over Cheese Rock.
LW slack survey Actually I have passed near Cheese Rock at
close to LW slack [HW(Liv)+4 hrs to +4:15 hrs] but on a neap(ish) tide:
on 9 Sept 2015 at 13:00. With tides [Liv(Gladstone) HW 9:23, 7.9m; LW
16:06 2.7m] this corresponds to HW(Liv)+3:37 or LW(Liv)-3:06. Slack
water at the Platters (neap) is quoted as LW(Liv)-2:45 while it is
LW(Liv)-3:00 at Pwllfanogl, so I was about 20 minutes before slack. I
found depth 3.5 to 3.6m going from 53 12.969, 4 10.992 to 53 12.972, 4
10.980 (about 12m long) with surrounding seabed over 1m deeper.
Allowing for my measurements being at 20 minutes before slack: the
depths registered at slack would be about 0.3m less. So 3.2 to 3.3m.
Now to evaluate the result for a spring tide, the range must be
increased by a factor (9.3-1.2)/(7.9-2.7)=1.56 using Liverpool ranges.
Spring range is 4.8m at PD; 5.8m at PF; 6.7m at MB. So using the PF
value, the change at LW will be from ML-2.9 at springs to ML-1.9 at the
date of survey. The change at LW slack will be somewhat less, but, for
safety, using LW itself: the LW slack spring depths would be 2.2 and
2.3m. These are in rough agreement with the values (2.0m) derived from my
HW slack results.
Menai tidal model. As a cross-check of these conclusions, one
can compare with the Bangor University model of Menai tides (as
illustrated previously) which shows mean spring tidal levels at
Britannia Bridge which are close to a sinusoidal variation with range
5.8m; mean level above OD of 0.3m; duration 6 hours and HW 30 minutes
before HW Liverpool (Alfred). This model gives depth at HW slack
(HW-1:48) as 2.5m above OD and at LW slack (HW+4:30) as 1.9m below OD;
corresponding to 2.2m above ML and 2.2m below ML.
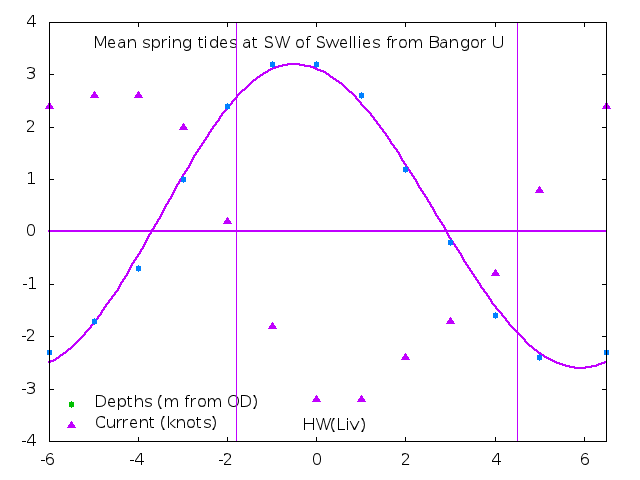
Caption: From Bangor University Menai tidal model. For mean spring tides with time from Liverpool(Alfred) HW in hours for one tidal cycle. Location at SW end of Swellies, near Britannia Bridge. Green circles are depth (compared to OD) in metres with magenta curve being a sinusoidal fit. Triangles show current (positive to NE) in knots. Vertical lines at HW-1:48 and HW+4:30 show slack at that location with depths OD+2.5m and OD-1.9m respectively.
Then correcting for the ranges (at Liverpool 6.9m and 5.2m compared
to 8.1m at springs): would give heights 1.9m and -1.4m at HW and LW
slack compared to ML. So a difference of 3.3m which can be compared
with my observations at Cheese Rock of 6.1m and 3.6m. Allowing for the
fact that I observed before slack, and height was increasing/decreasing
(at HW/LW slack) by about 1.3m during the previous hour at springs
according to the model, then spring tide levels 30 minutes earlier would
be about 1.6 and -1.6m from ML which, after correcting for tidal
range, gives 1.4m and -1.0m. This height difference between HW and LW
slack agrees well with the 2.5m observed.
The conclusion is then that Cheese Rock is consistently at about
4.6m below ML or 4.3m below OD. At LW spring slack, Cheese Rock will
have depth about 4.6-2.2=2.4m. Moreover, before LW slack, the depth
will be even greater.
At actual LW, the tidal flow will be strong to NE, so an accurate
model of tidal depths is not feasible.
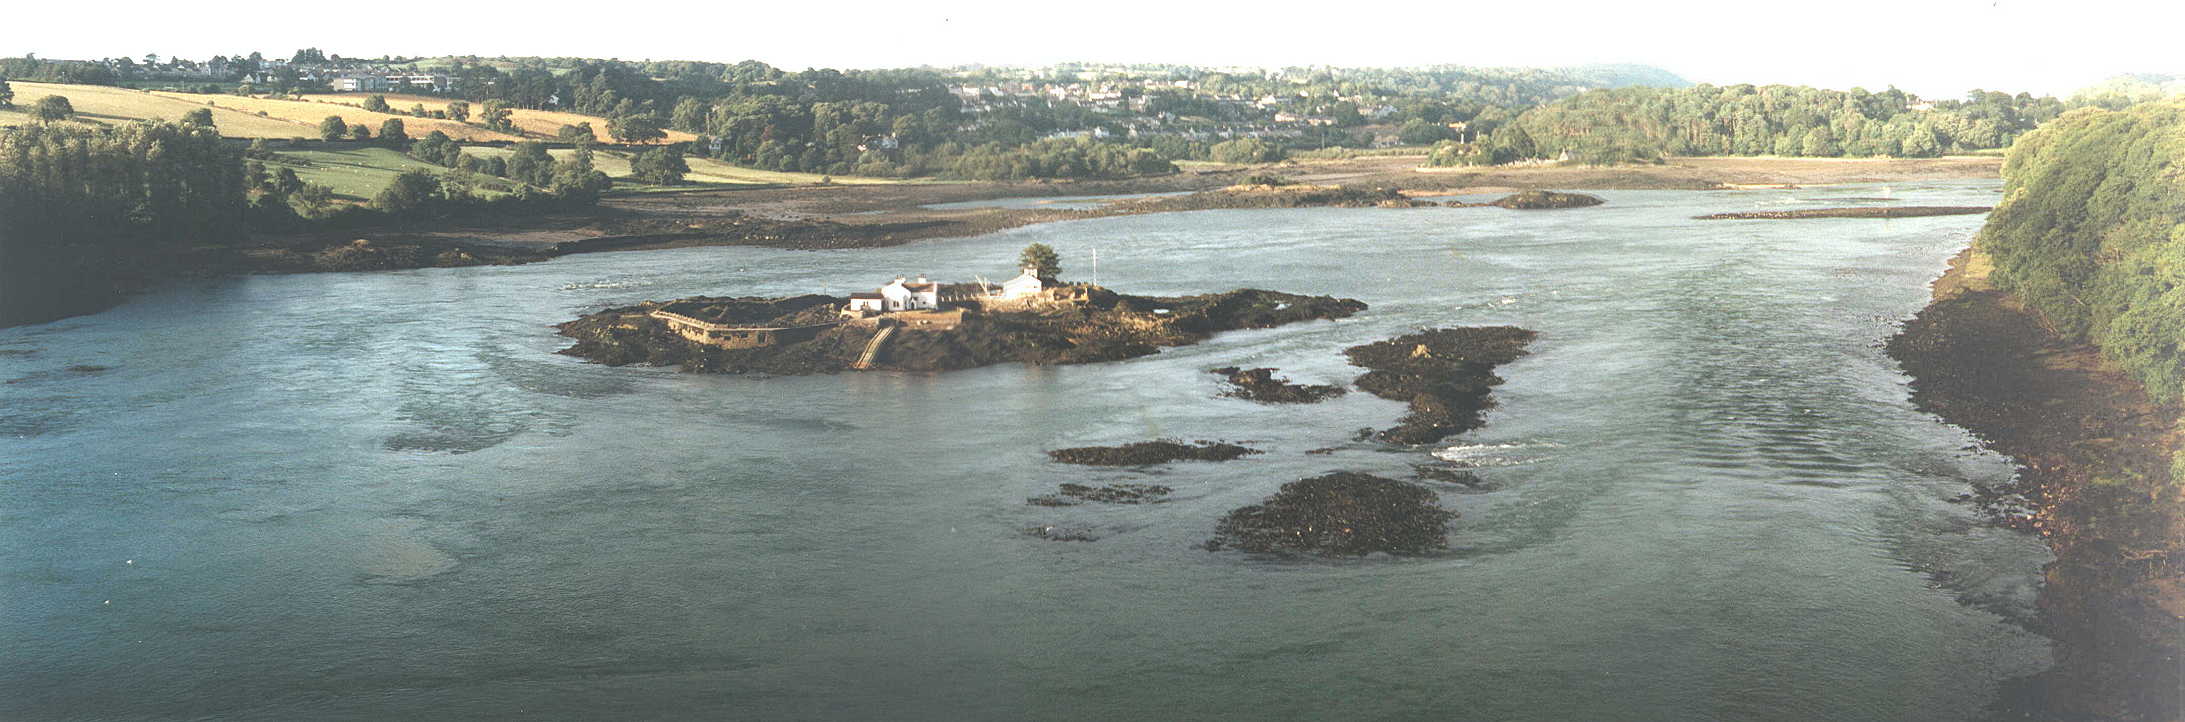
However, photographic evidence shows
that at one of the largest tides of the year (10m Liverpool), the rock
SW of Gored Goch does not break the surface at LW, though the disturbed
water from it can be clearly seen. Now Goddard's chart gives this rock
as lying 4.5 ft higher than Cheese Rock. So Cheese Rock must be at
least 4.5 ft (1.4m) underwater at this time (extreme LW). This again
suggests that Cheese Rock is not a potential obstacle at LW slack for
vessels drawing less than 2 m.
Other data In 2000, measurements by Richard Jones using a tide gauge gave depth over Cheese Rock of 6.6m at HW slack-40' and 7.4m at HW slack, with slack at HW(Liverpool: Alfred) -2 hrs and HW(Liv) 9.9m. This is a big spring tide with a Liverpool range (9.9-5.2)/(9.3-5.2)=1.15 times mean springs whereas my survey had a Liverpool range (8.7-5.2)/(9.3-5.2)=0.85 times mean spring range. Then taking a mean spring range of 5.8m at Cheese Rock (PF) the change in depth would be (1.15-0.85)*2.9= 0.9m. So 6.6m at HW slack-40' will correspond to 5.7m for the smaller tide I experienced. This is close to my result obtained at that time (6.0m).
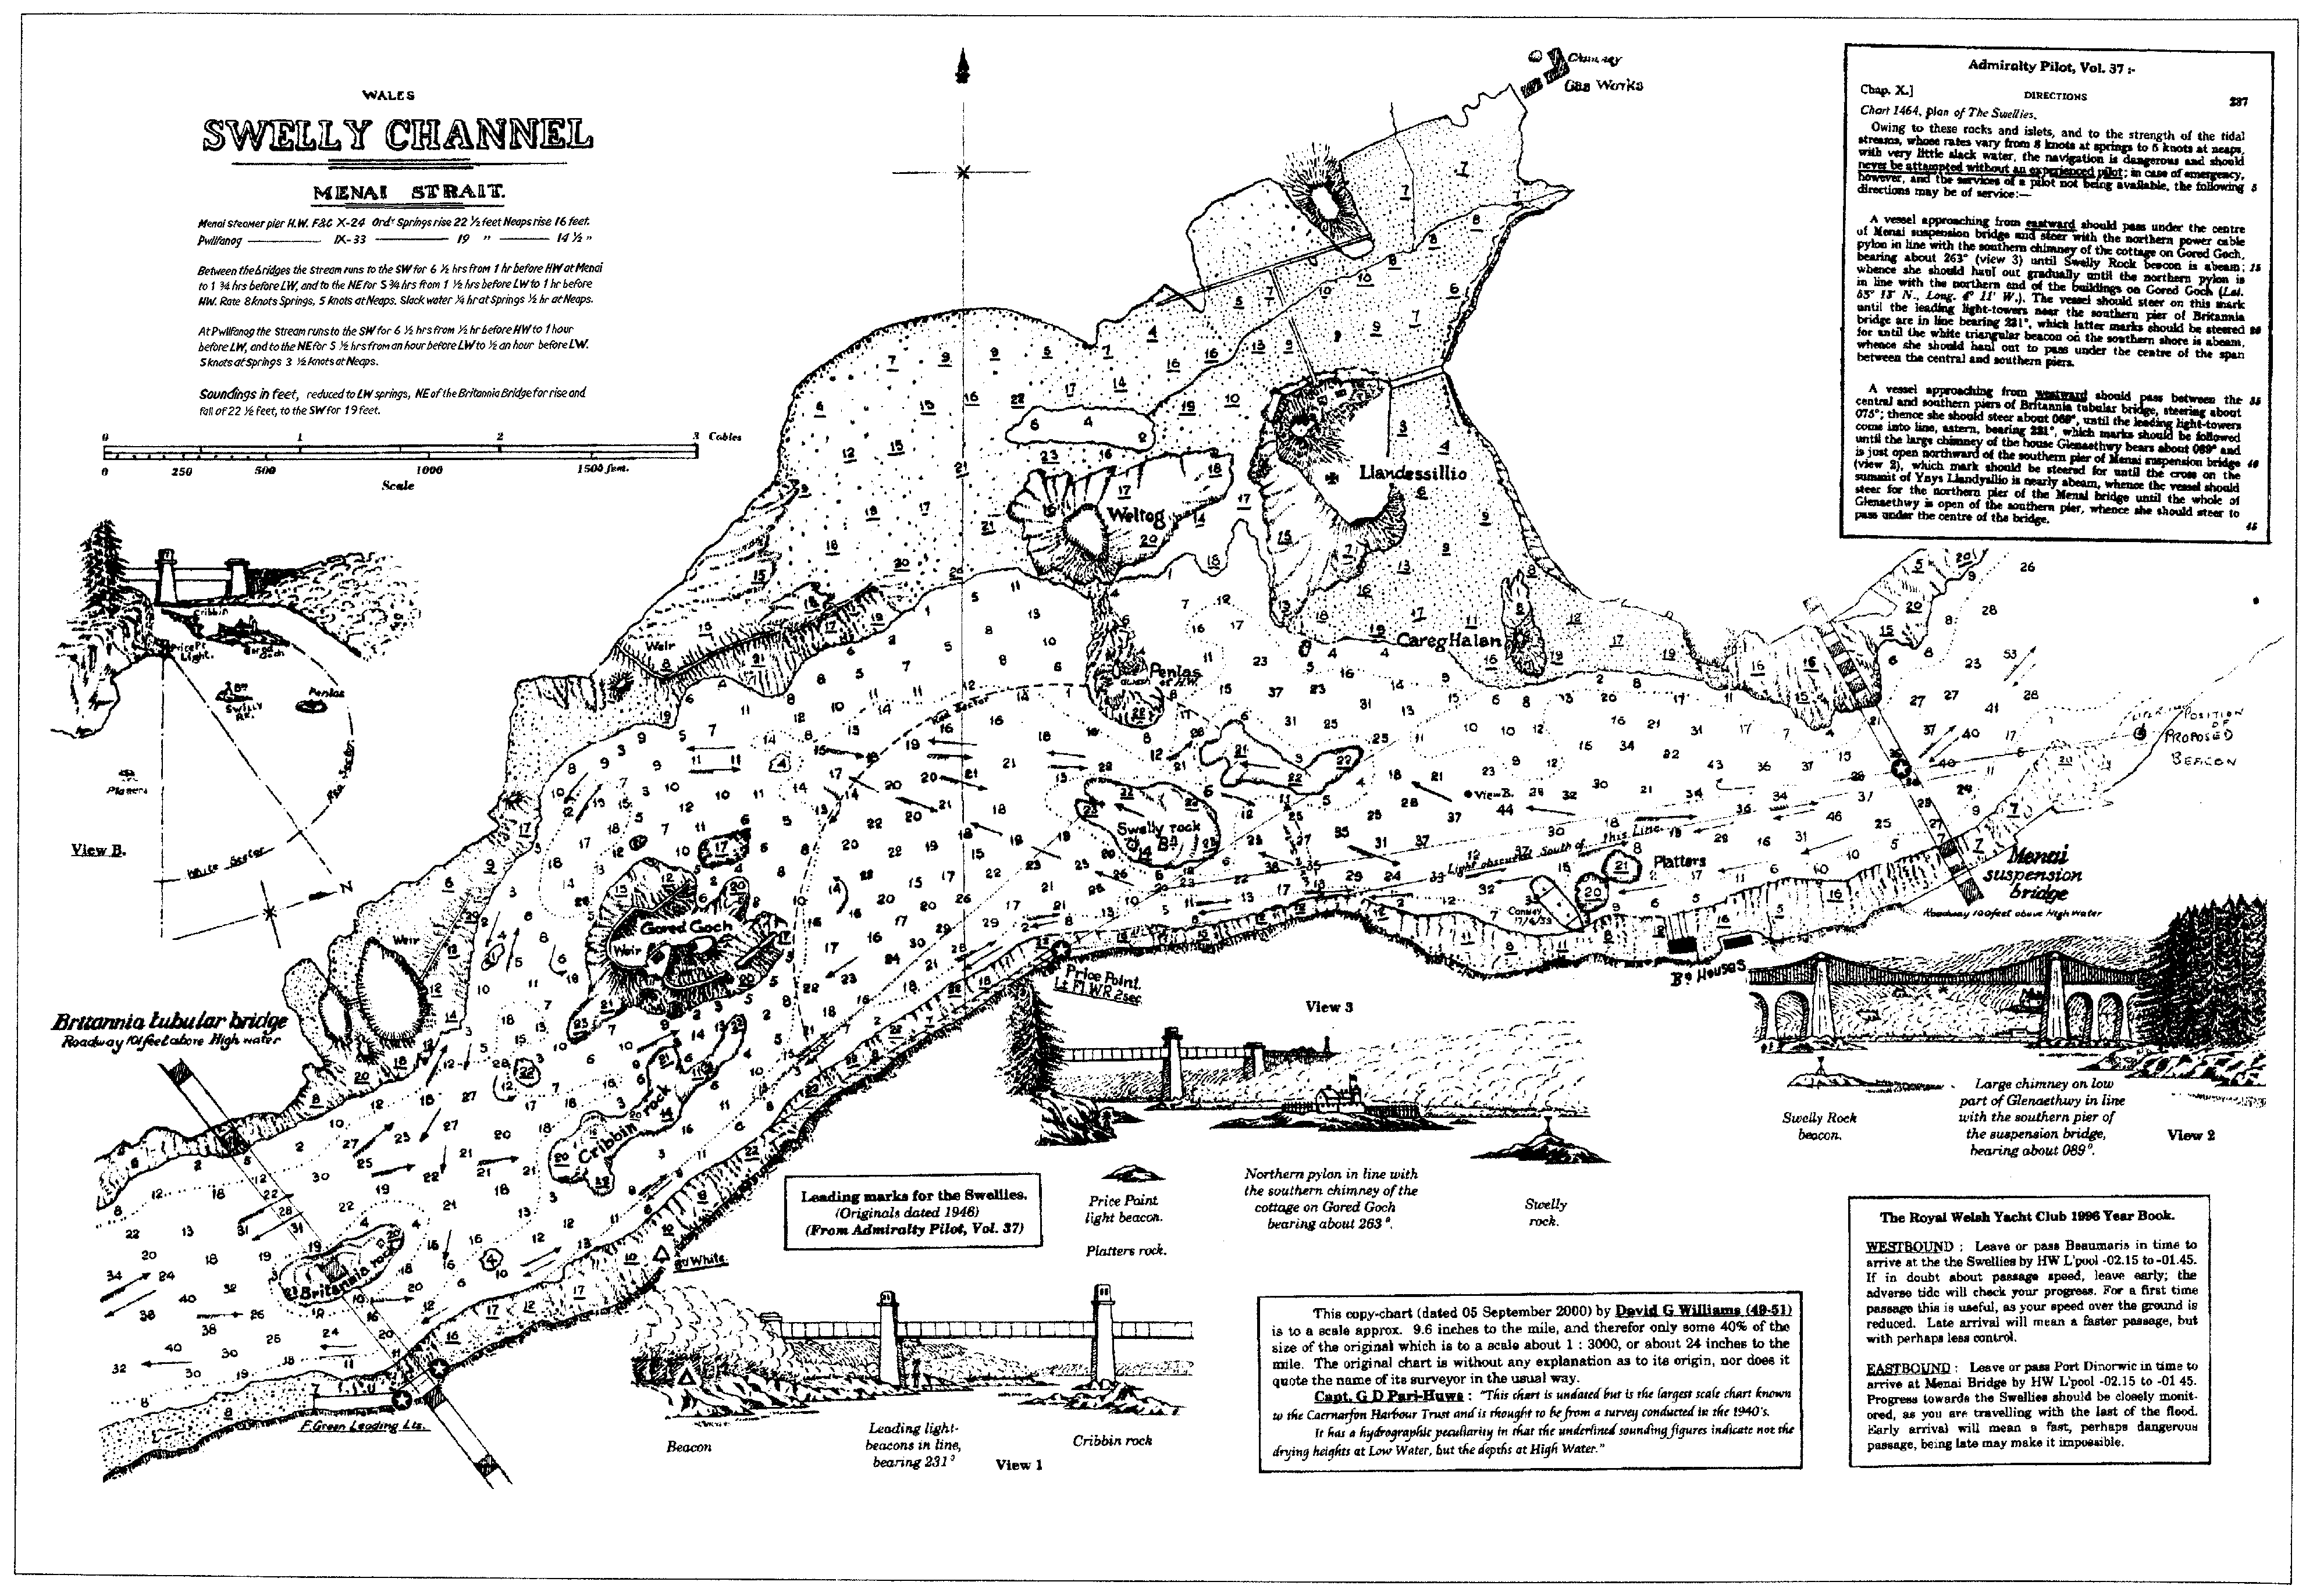
Goddard's Chart. See here.
A further piece of evidence is that contained in the manuscript chart
created by Capt Goddard of the Conway, prior to the successful move in
1949 from Bangor to off Plas Newydd. This chart shows a depth of 4 ft
(1.2m) over Cheese Rock. Although Captain Goddard had surveying
experience, this chart was intended for his own use and has non-standard
features. In particular, the depths between the bridges are presented
below LW assuming a spring range of 22.5 ft. This implies that charted
depths are to a datum approximately 11.25 ft (=3.4m) below ML.
Assuming the tides at Cheese Rock are similar to those Goddard
observed at Pwllfanogl, then spring LW will be 2.9m below ML. So depth
over Cheese Rock at LWS would be 5.75 ft (1.75m). At LAT, the depth will
be less: about 0.7m less using PD and MB values. So depth over Cheese
Rock at CD (=LAT) would be 1.1m.
If the tidal range at Cheese Rock were more like the tide at Menai
Bridge, then the depth over Cheese Rock would be as on his chart at LWS
and hence at LAT 0.5m. This latter assumption is somewhat ruled out by
the observations, above, of Richard Jones and the photograph at extreme
LW.