COVID: how scientists can help tell if someone caught the virus at a nightclub

This article by Professor Simon Maskell, and Professor Iain Buchan was first published for`The Conversation':
Crowds totalling over 13,000 people were in high spirits at two pilot events in Liverpool at the Circus nightclub and the Sefton Park Pilot music festival in early May. These were part of the UK’s Events Research Programme, giving audiences a taste of the old norm – gathering with no social distancing or face coverings – to see what effect mass events might have on the spread of the coronavirus.
Attendees had to have a recent negative rapid lateral flow test to show they were unlikely to have COVID-19. But no test is perfect – all COVID-19 tests, including lateral flow tests, will miss some cases. It was therefore possible that some attendees were infected and could have infected others. If similar events are to reopen soon, it’s important to know just how great this risk is.
Testing and statistics have helped us find this out. Each attendee took their lateral flow test in the 36 hours leading up to the event. They were then asked to take a different type of test (a PCR test, using a kit at home that is sent to a lab for analysis) both on the day of the event and five days later.
Lateral flow tests are simple. They quickly give a yes or no answer on whether someone has COVID-19, working a bit like a pregnancy test.
The PCR tests used were a bit more sophisticated. They showed not just whether people were positive, but also gave a number called the “cycle threshold” (Ct) that reflects the amount of coronavirus on the person’s test swab. The lower the Ct number, the higher the amount of virus someone has in their body, and so the more infectious they probably are. (Negative PCR results are those where Ct is higher than a certain level.)
Working out the time of infection
Assessing whether an event is safe requires using these tests to work out how many people caught the virus at or around the event. To do this, firstly you use the follow-up tests to find out who is carrying an infection shortly afterwards. Then you estimate when any test-positive individuals caught the virus: before, during or after the event.
To infer when the virus was picked up, you need to understand the dynamics of a COVID-19 infection. These are pretty simple. Inside the body, COVID-19 has two distinct phases: an exponential increase in the amount of virus present as it takes hold (with Ct therefore decreasing), and an exponential decrease as the person sheds the virus (with Ct increasing).
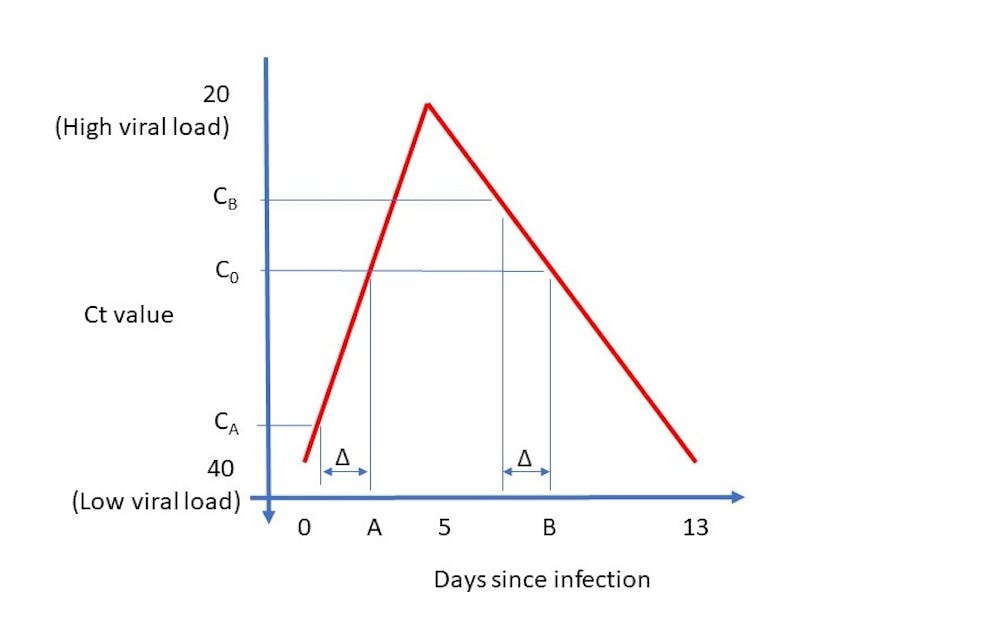
Using existing data and analysis of lots of previous infections, we can come up with an average trajectory of a COVID-19 infection. Plotted on a graph, the amount of virus in the body across an average person’s infection – as measured by the Ct number – looks like the red line below.
Author provided
If someone returns a positive PCR test after the event, the Ct number from their test could represent one of two points in the infection – one when their infection is growing and one when declining.
For example, in the graph above, if the person’s Ct number is C0, then their test was taken either at point A in time (on the X axis) or point B. As we know how much time has passed between them attending the event and taking their PCR test (represented by Δ on graph), we can look backwards to end up with two estimates of their Ct level when attending the event: CA and CB. This also gives us two estimates of how far they are into their infection, and therefore two estimates of when they got infected.
But which is correct? Well, we know the person had to have a negative test 36 hours before the event to attend. Lateral flow tests may be falsely negative when people have small amounts of virus in their body, but are much less likely to give a false negative when someone has a high viral load.
So if one of the two possible levels of infection at the time of the event – CA and CB – indicates a high viral load but the other doesn’t, the high viral load case can likely be discounted. Indeed, we can use historic data on the accuracy of lateral flow tests to work out the probability of a test returning a negative result when the Ct number was each of CA and CB, and use this to tell us which of the two estimates for when they got infected is the more likely.
This means that for every person who tests positive on a PCR test after the event, we have a best estimated time for when they caught COVID-19. For those whose estimated infection time is before the event, we assume that they picked up the virus elsewhere shortly beforehand, and that their lateral flow test failed to identify their infection – possibly because they were early on in their infection and so still only had low amounts of virus in their body. We can also estimate when their viral load peaked, and thus how infectious they were at the event.
And for those whose infection time appears to be at or very shortly after the event, we can assume they were infected while attending. We can then compare these two groups – the infectious and infected – to see how much transmission took place and how risky the event was.
Pleasingly, using these techniques we found that the Liverpool events had no impact on the spread of COVID-19 in the Liverpool area. But by looking to see if these events were safe, we were only informing policy makers. They had the unenviable task of assessing whether the risk identified was low enough to return us to life as we once knew it.![]()
Simon Maskell, Professor of Autonomous Systems, University of Liverpool and Iain Buchan, Chair in Public Health and Clinical Informatics, University of Liverpool
This article is republished from The Conversation under a Creative Commons license. Read the original article.